Filters panel
The filters panel is available for specific widgets to configure them or define what objects they should take into account. Click on Show Filters Panel in the top bar to open the side panel.
The filters panel is only available when at least one of the following widgets is placed on the dashboard:
- ESG/Media reporting
- Charts
When you’re editing a chart widget with a dynamic plot, the filter panel is also available.
Apply or save filters
The filters panel consists of several tabs, each of which allows you to set different filters or settings.
After you’ve made changes in the filters panel, you can either click on Apply Filters at the top right to apply the changes and refresh the widgets, or you can click on Save Filters to save the current filters.
Apply Filters |
Applying the filters will update the widgets, but the filters will not be saved. After you reload the page, the filters will be reset to the last saved state. This lets you do quick analyses without affecting other users. |
Save Filters |
Saving the filters will persist them, so that they are automatically applied when you navigate to the current dashboard in the future. Note that the filters will be saved per dashboard, and that the changes will become effective for all other users, too. |
General
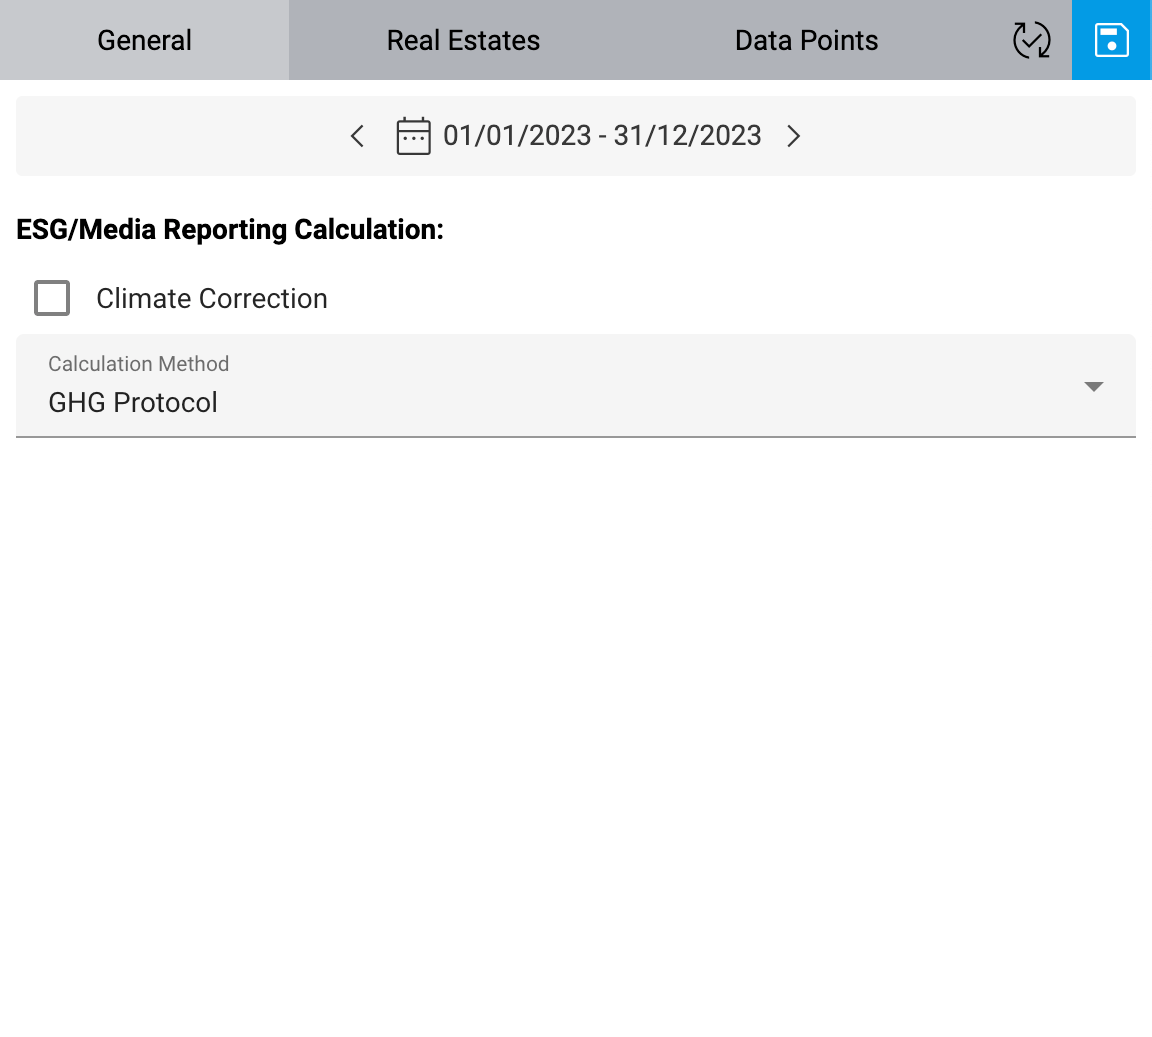
On the General tab, you can change the time interval for which data should be displayed on the widgets.
For widgets related to ESG/media reporting, the following options are available:
- Climate correction
Select whether climate correction should be taken into account.
- Calculation method
Select which calculation method should be used to calculate the ESG/media reporting.
- GHG Protocol
Greehouse Gas Protocol (ghgprotocol.org)
- KBOB / ecobau / IPB 2009/1:2022
KBOB recommendation for environmental performance data in the construction sector (kbob.admin.ch)
Apply or save the changes with the buttons at the top right.
Real estates / groups
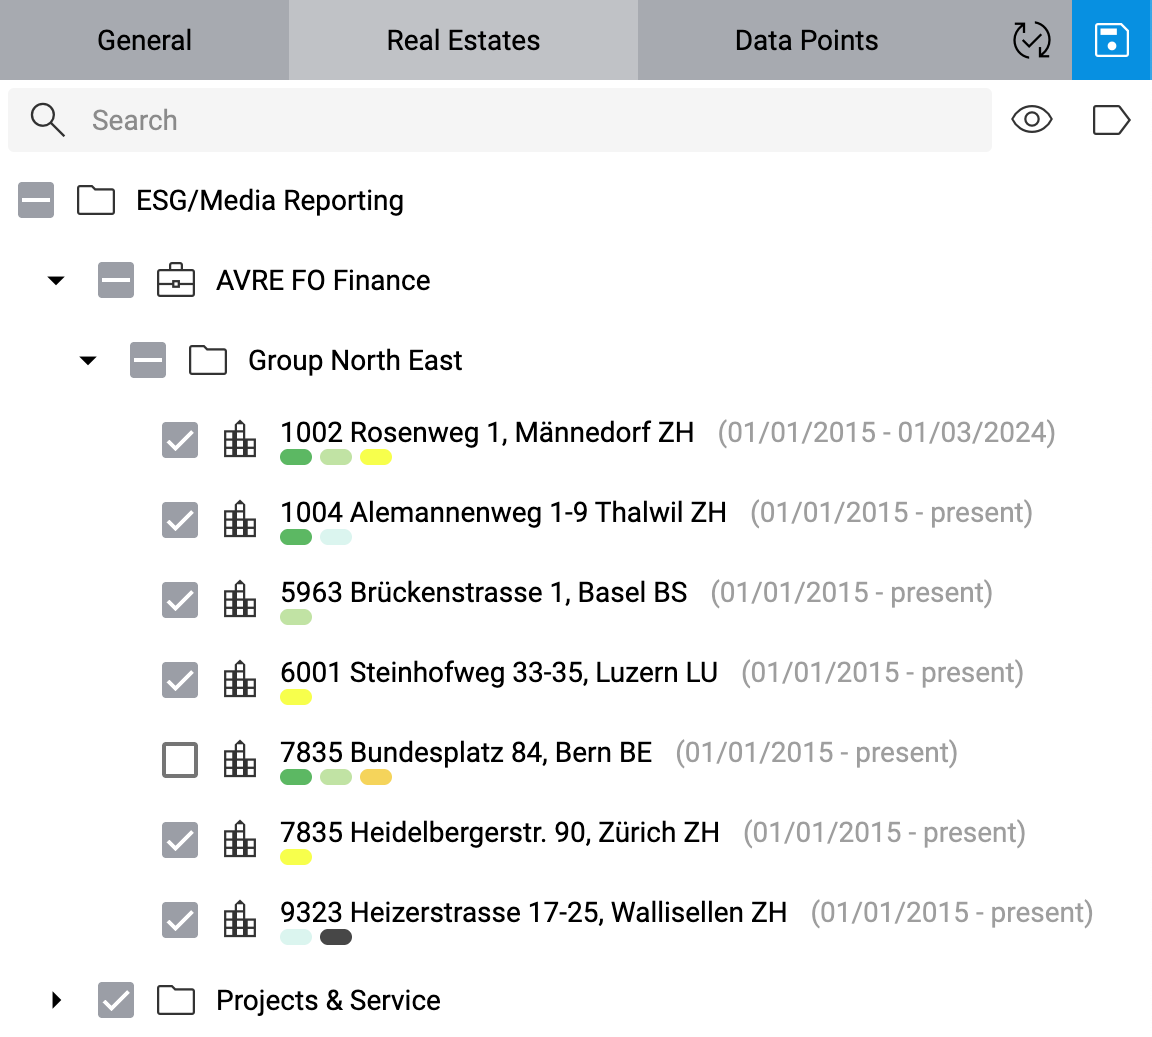
Groups, real estates and portfolios can be filtered on the Real Estates or Groups tab, respectively.
- Real estates
The Real Estates tab is available if at least one of the widgets on the current dashboard is a ESG/media reporting widget. Select all real estates or portfolios whose assigned data points should be taken into account in the calculation of the ESG/media reporting widgets. Note that only real estates that have the ESG/Media Reporting option enabled are shown in the filter tree. This option can be set on the Real Estate Details widget.
- Groups
The Groups tab is only available if a Chart widget with one or more dynamic plots, but no ESG/media reporting widget is placed on the current dashboard. Only subgroups of the currently selected group in the group navigation are shown here. Select all groups whose assigned data points should be taken into account.
Note that if you’re viewing a chart widget in full screen or you’re in edit mode, the filters panel will not be visible. Use the Back to Dashboard button at the top left to go back to the dashboard view to access the filters panel. If the panel is still not visible, toggle it with the Show Filters Panel button at the top right.
Selecting or unselecting a group will select or unselect all groups below. The filter options in the toolbar above the group tree can help you find and select the desired groups. You can search for specific portfolios or real estates in the Search box, and you can hide all unselected groups by clicking on Hide Unselected.
Use the Group Tags icon to filter the groups by specific group tags. The icon changes color if there is at least one filter active.
After you entered a search string or selecteded any filters, the Clear Filters icon allows you to clear them with a single click.
Note
If some items are hidden in the tree due to active filters, a icon might appear next to some checkboxes, indicating that those particular items have hidden subitems whose selection status is opposite to that checkbox. Note that the calculation still takes all selected items into account, including those that are currently hidden.
Apply or save the changes with the buttons at the top right.
Data points
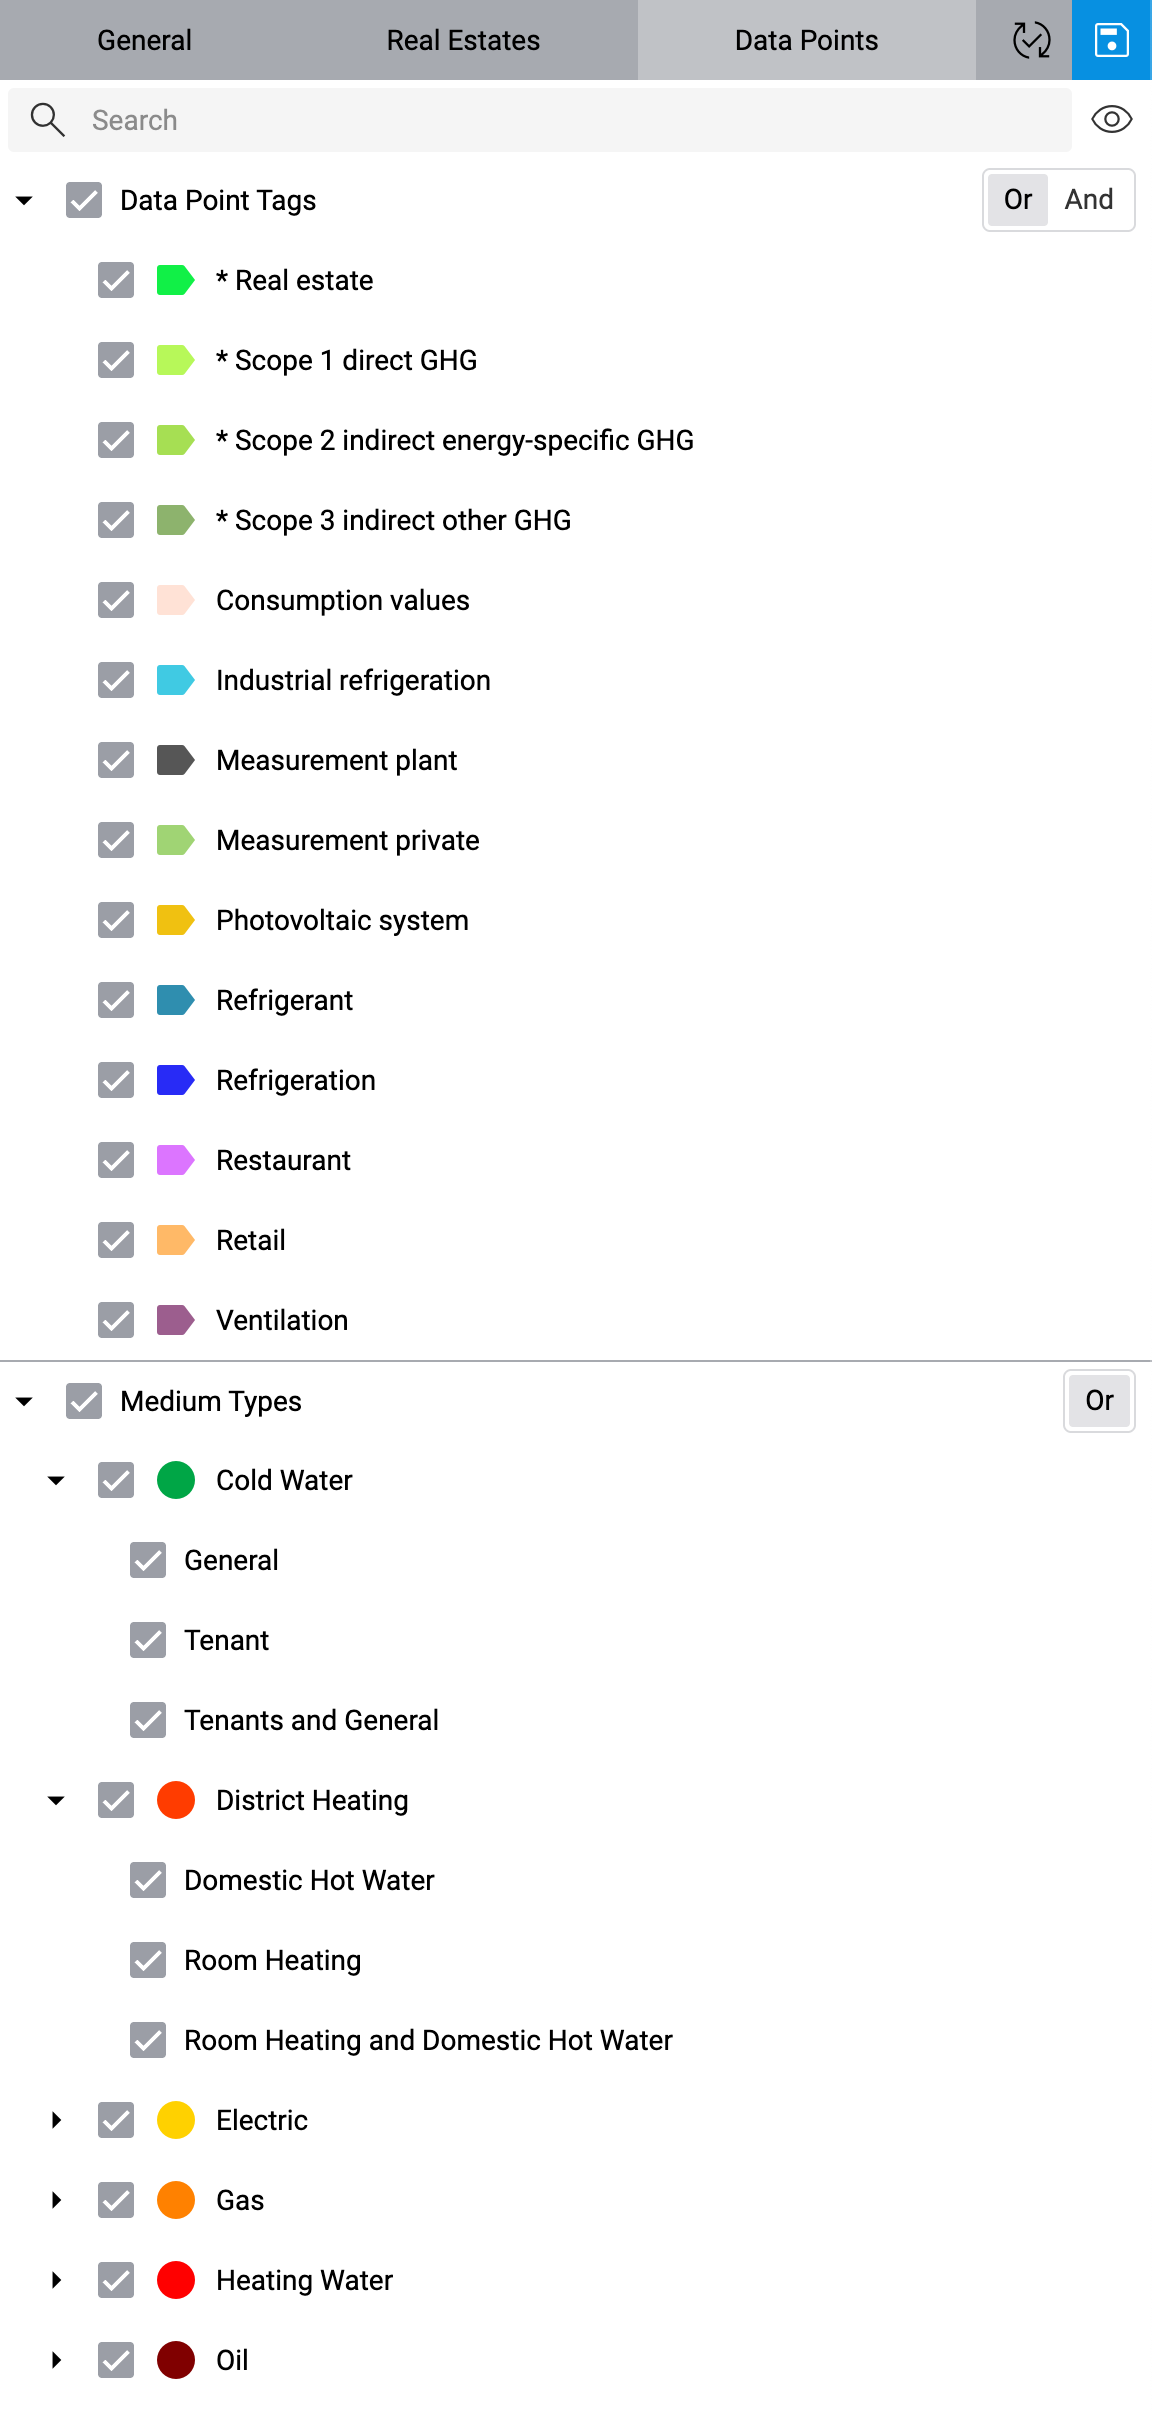
On the Data Points tab, you can select all data point tags and medium types that should be taken into account. Only data points that either have one of the selected medium types or at least one of the selected tags will be taken into account.
By default, any data point that matches any of the selected data point tags will be taken into account. If you want to include only data points that match all of the selected data point tags, you can use the toggle button next to the Data Point Tags node to switch to And mode. Note that this toggle button only affects data point tags, not medium types, since data points can have multiple data point tags, but only one medium type, after all.
If no data point tag is selected, data points are not filtered by tags, and all data points are taken into account instead (based on the selected medium types).
If no data point tags are available, the option Data Point Tags is disabled. You can manage data point tags on the card Tags on the detail view of any data point.
You can search for specific tags or medium types in the Search box at the top, and you can hide all unselected groups by clicking on Hide Unselected.
Note
If some items are hidden in the tree due to active filters, a icon might appear next to some checkboxes, indicating that those particular items have hidden subitems whose selection status is opposite to that checkbox. Note that the calculation still takes all selected items into account, including those that are currently hidden.
Apply or save the changes with the buttons at the top right.