ESG/media reporting
Our ESG/Media Reporting widgets can be used to visualize and analyze the energy consumption and greenhouse gas emissions of your real estates and portfolios.
The calculation is based on the selected real estates, portfolios, medium types and data point tags and takes changes of ownership, energy products and coefficients into account, even if they occur during the year.
Before you can use any of the widgets, you have to set up the ESG/media calculation as follows:
Configure the performance indices for ESG/media reporting on every portfolios.
For each real estate that you want to include in the ESG/media calculation, place a Real Estate Details widget on a dashboard. On that widget, do the following in edit mode:
In the section General, enable the option ESG/Media Reporting.
Set the ERP ID and Group Ownership.
In the section ESG/Media Reporting, click on Manage Coefficients and manage the factors and coefficients of your energy products (see Manage primary energy factors and greenhouse gas emission coefficients). Close the dialog when you’re finished.
Now add all the data points that you want to include in the calculation of your greenhouse gas emissions by clicking on Add Data Point, then select the data point, the provider or product of the energy source, and the time interval for which this product is consumed. If the provider or products changes for a given data point, don’t update the existing entry. Instead, add the same data point again, select the new product and define the new time interval. This ensures that the calculation of consumption values from the past are not affected by the new energy product.
Performance indices for ESG/media reporting
Performance indices related to entire portfolios can be configured on the corresponding portfolio groups in your project tree.
These settings will be taken into account behind the scenes when using any of the ESG/Media Reporting widgets.
Click on Show Navigation at the top left to open the project tree, then select a portfolio in the tree.
If you don’t already have a portfolio, create a new group or select an existing one and change its group type to Portfolio. For more information on how to create groups, see Create new groups.
Click on Edit Groups and then on Edit Group to edit the following parameters on your portfolio:
- Reference Base Year
Enter the year that should be used as the baseline for calculating CO₂ emission reduction.
- Targeted CO₂ Emission
Specify the targeted CO₂ emission for a specific year. Click on Edit Targeted CO₂ Emission to open the dialog Targeted CO₂ Emission. To add a new emission target, click on Add at the bottom and enter a year and the targeted emission for that year in kg/m². If you don’t provide a target value for a specific year, the last available value will be used.
- Targeted Energy Consumption
Specify the targeted energy consumption for a specific year. Click on Edit Targeted Energy Consumption to open the dialog Targeted Energy Consumption. To add a new consumption target, click on Add at the bottom and enter a year and the targeted consumption for that year in kWh/m². If you don’t provide a target value for a specific year, the last available value will be used.
Performance
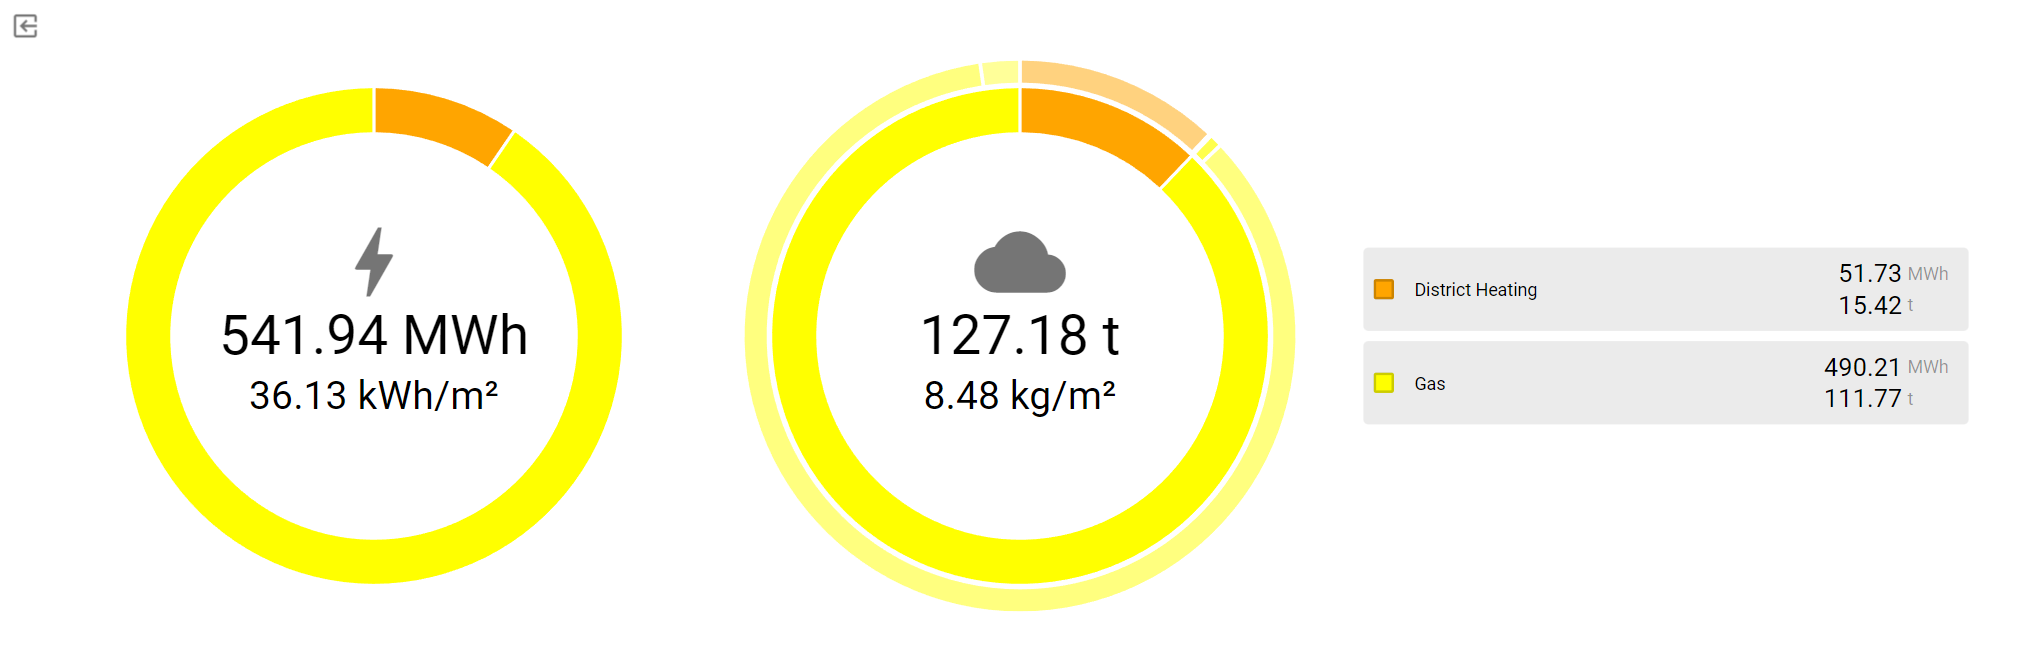
The Performance widget shows the energy consumption and greenhouse gas emissions (CO₂) of individual real estates or entire portfolios, both with total and specific (relative) values.
You can limit the scope of the calculation with the filters panel by changing the time interval and selecting real estates, portfolios, medium types and data point tags.
Reduction pathway
The Reduction Pathway widget shows the specified reduction pathway as well as the actual reduction pathway of the selected real estates or porfolios.
You can limit the scope of the calculation with the filters panel by changing the time interval and selecting real estates, portfolios, medium types and data point tags.
The reference base year and the targeted reduction of energy consumption and CO₂ emissions can be configured on the portfolio group (see Performance indices for ESG/media reporting).
Media reporting
The Media Reporting widget shows the consumed energy for each of the selected real estates or porfolios in a table, broken down by medium. This can help improve traceability and simplify audits. The summary is based on the medium types and units of the underlying data points.
You can limit the scope of the calculation with the filters panel by changing the time interval and selecting real estates, portfolios, medium types and data point tags.
Each row in the table represents one of the real estates in the selection, and each column contains the combined usage of the given medium type. The bottom row shows the total of each column.
The background color and icon in each cell represents the deviation of the value relative to the previous time period:
red: increased consumption
green: decreased consumption
You can drill down to individual data points of each real estates by clicking on any of the rows in the table. To go back to the list of real estates, just click on Media Reporting at the top left of the table.
The content of the table can be downloaded as an Excel worksheet by clicking on Download at the top right of the table.
If you click on the Add to Chart icon in one of the cells, the calculation history of the given cell is displayed in a chart at the bottom of the screen. The widget will be displayed in full screen to better accommodate the chart. You can add multiple plots to the chart and change the time period independently from the filters panel. Above the chart, you have the option to change the time period of the chart, and you can download the chart by clicking on Download, or to configure the chart via the More menu:
- Show Legend
Show or hide the legend below the chart. If the legend is displayed, you can easily toggle the visibility of individual plots by clicking on their name in the legend.
- Aggregation Interval
Change the interval for which the consumption should be calculated:
Day
Week
Month
Year
- Stacking
Define how the columns should be stacked if there are multiple plots in the chart:
No stacking: Line plots overlap and column plots are displayed side by side.
Absolute: Plots are stacked on top of each other.
Relative: Plots are stacked on top of each other, relative to the sum of their values (= 100 %).
- Remove Plot
Click on a specific plot to remove it from the chart.
- Remove All Plots
All plots will be removed from the chart.
Emission breakdown
The Emission Breakdown shows the calculation details for each of the selected real estates or portfolios.
You can limit the scope of the calculation with the filters panel by changing the time interval and selecting real estates, portfolios, medium types and data point tags.
Each row in the table represents one of the real estates in the selection, and each column contains a specific consumption value. The bottom row shows the total of each column.
You can drill down to individual data points of each real estates by clicking on any of the rows in the table. To go back to the list of real estates, just click on Emission Breakdown at the top left of the table.
The following columns are displayed:
Always
Total Greenhouse Gas Emission [kg CO₂ e]
Specific Energy [kWh/m²]
Specific Greenhouse Gas Emission [kg CO₂ e/m²]
GHG Protocol only
Used Energy Total [kWh]
Biogenic CO₂ Emission [kg CO₂]
Non-Biogenic CO₂ Emission [kg CO₂]
KBOB / ecobau / IPB 2009/1:2022 only
End Energy Total [kWh]
Primary Energy Renewable [kWh]
Primary Energy Non-Renewable [kWh]
Primary Energy Total [kWh]
The content of the table can be downloaded as an Excel worksheet by clicking on Download at the top right of the table.
Filters panel
If you want to configure the time interval, the real estates and the data points that should be taken into account in your ESG/media reporting widgets, use the filters panel.