Carpet plot (heatmap)
Using the Carpet Plot chart type, you can display the measurement values of a single data point on a two-dimensional surface spanned by two time axes. The x-axis is the chart interval (usually one year), and the y-axis is the hours of the day. This gives you a carpet on which each field corresponds to one hour of the chart interval.
Carpet plots or heatmaps are particularly suitable for visualizing certain temporal behavior patterns of parameters. Deviations can be discerned very quickly.
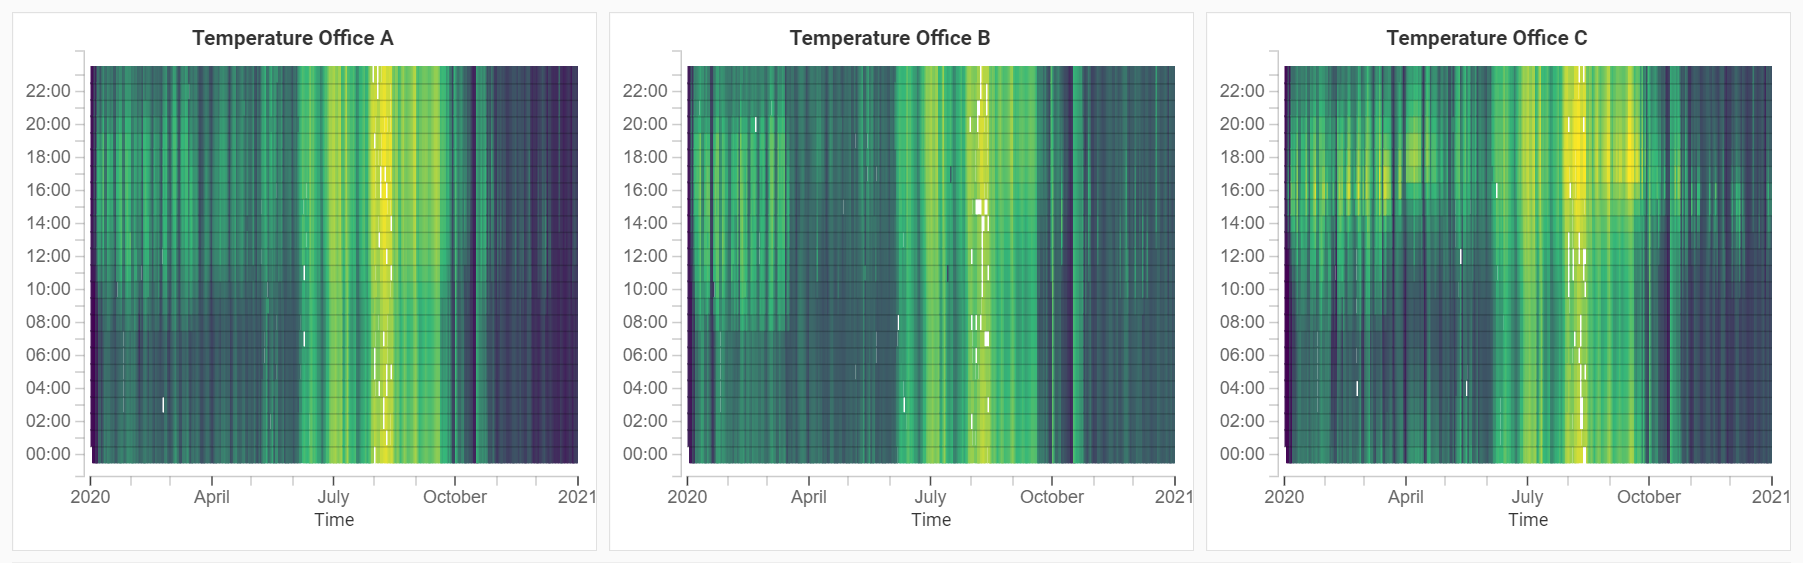
Heatmaps of room temperatures
To set up a carpet plot, proceed as follows:
Drag a data point from the data point gallery to the empty space below the Plots heading.
The new plot is selected automatically, allowing you to configure it. For example, change the colors of the value range or the primary data function.
Only one data point can be placed per carpet plot. Create more charts to visualize several data points.
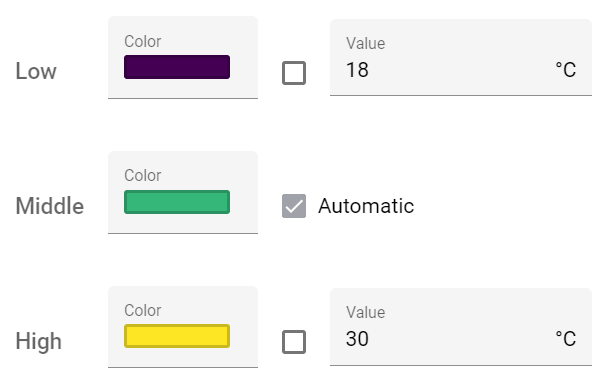
Colors of a carpet plot
You can configure three different colors for the carpet plot: one for low values, one for high values and one for medium values.
If you enable the checkbox Automatic next to a color, its corresponding measurement values on the chart will automatically be calculated. By default, the color Low will correspond to the lowest value in the selected time interval, the color High will correspond to the highest value, and the color Middle will correspond to the arithmetic middle between the highest and lowest value. However, you can disable the checkbox for any of the colors and specify a fixed value. This will skip the automatic calculation for that color. This feature can be useful if you have multiple carpet plots on the same dashboard and you want to make sure that the scale is alway the same, regardless of the actual values.
Plot segments for which no value can be calculated due to missing recordings are displayed as transparent. Bear this in mind for the visualization, so that values from the middle value range clearly differ from undefined values.
High |
Medium |
Low |
Gradient |
|---|---|---|---|
. #FD625E |
. #CCCCCC |
. #3599B8 |
. |
. #B31226 |
. #F8F1BB |
#2E3393 |
. |
. #FFFFFB |
. #FFA900 |
. #FF2500 |
. |
. #F7FBFF |
. #6AADD5 |
. #08306B |
. |
. #FDE725 |
. #35B779 |
. #440154 |
. |
. #FCFDBF |
. #B4367A |
. #000003 |
. |