Insert table
Standard table
You can insert chart and table report widgets in tabular form into your reports.
In Avelon Cloud, navigate to the desired dashboard and click on the desired chart or table report widget to display it in full-screen mode.
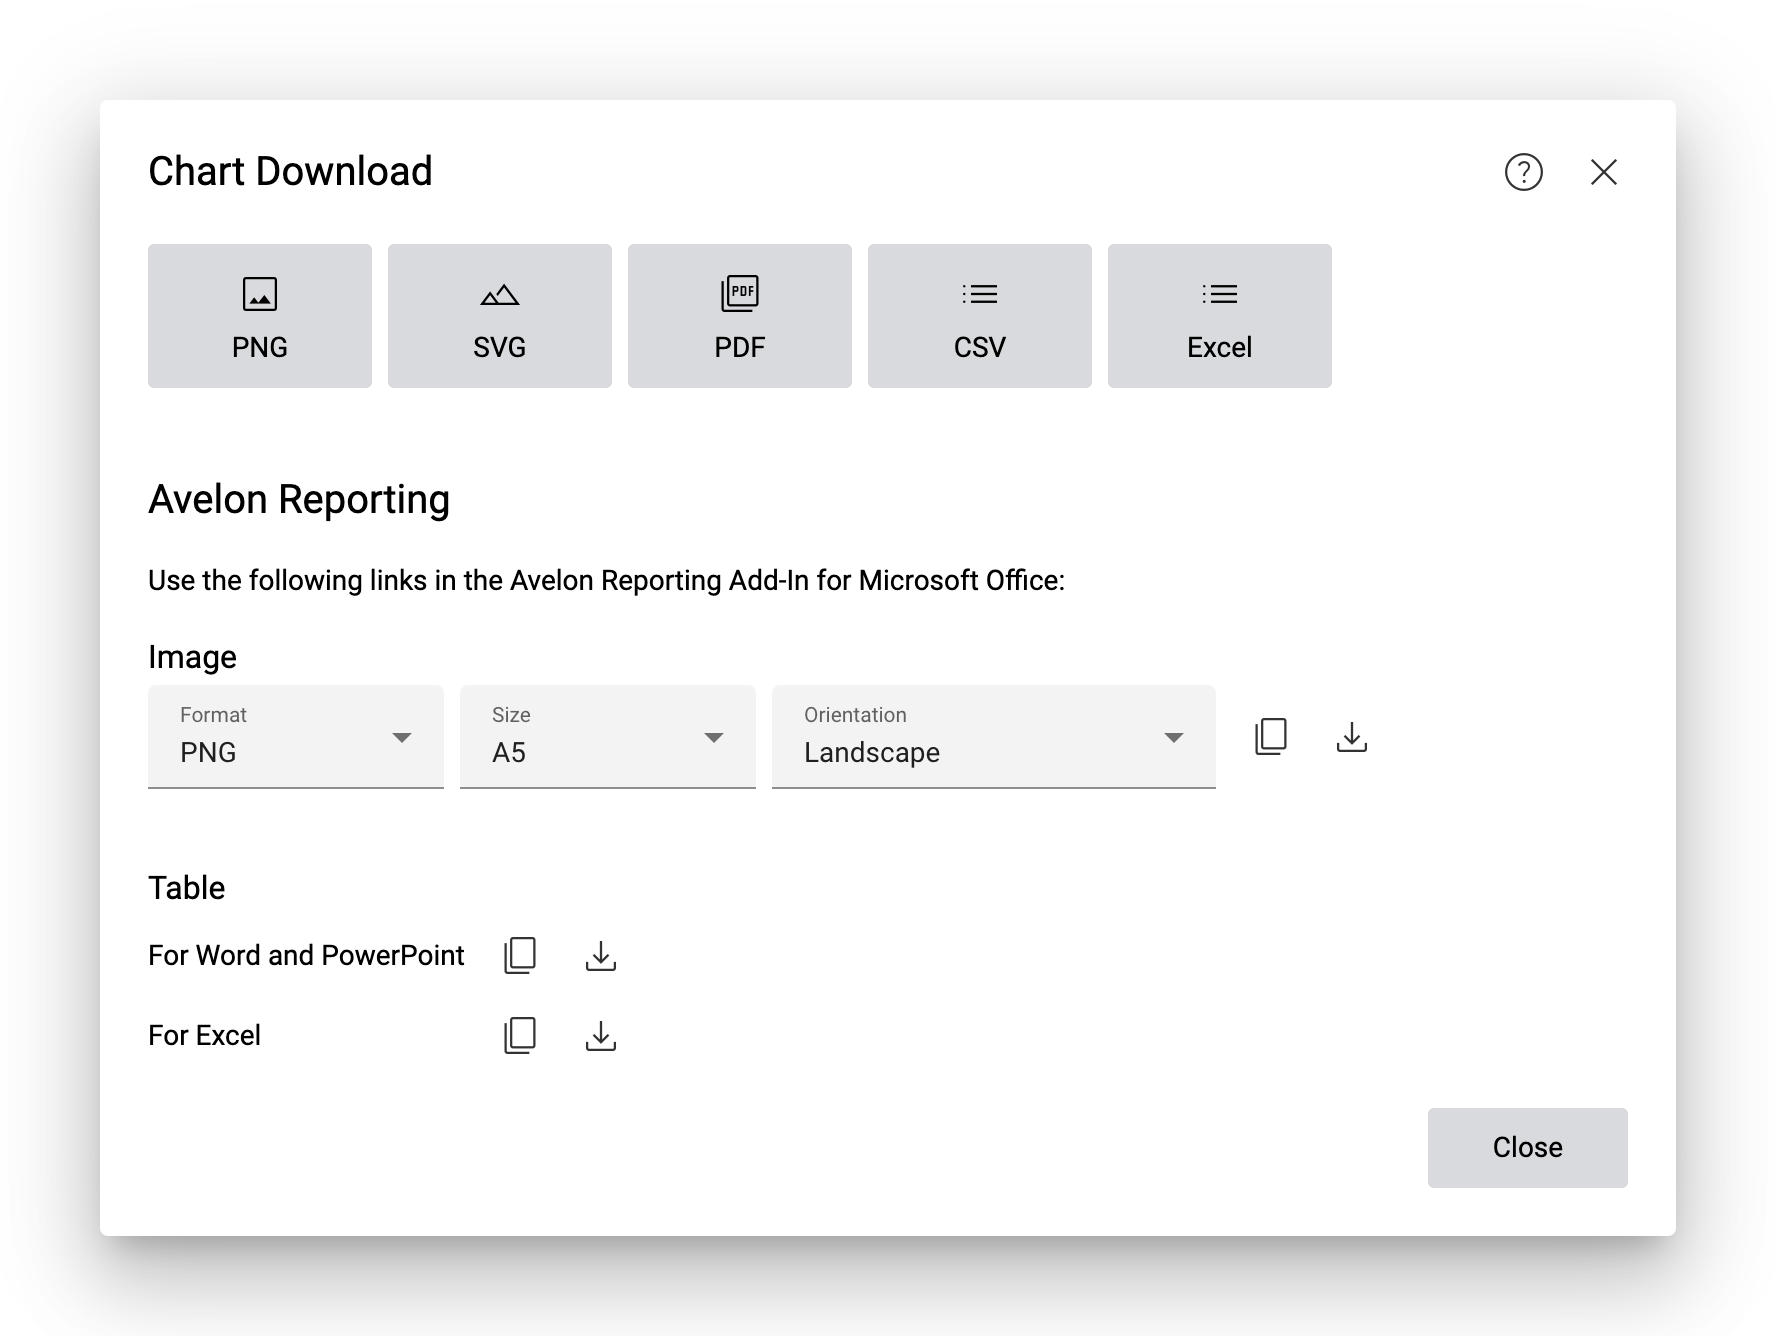
Click on Download in the action bar at the top right.
In the dialog window that appears, click on the Copy Link to Clipboard button next to the Table option, in the Data section.
- Table
- For Word and PowerPoint
Contains a tabular representation of the chart data as an XML file. This can be used in Microsoft Word and Microsoft PowerPoint.
- For Excel
Contains a tabular representation of the chart data as an XML file that is specifically designed for the Query Editor in Excel (“Get & Transform”).
Note
If you want to insert table data in Microsoft Excel, use the option For Excel and continue with the instructions in section Get and transform.
Close the dialog window and switch to your template file in Microsoft Office and go to the Avelon Reporting tab there.
Click Table in the ribbon.

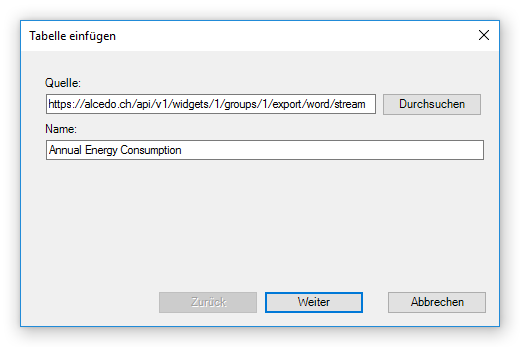
In the dialog that appears, paste the URL you just copied from the clipboard into the Source field, give the XML source a meaningful name (for example, the name of the chart), and click Next.
Under Table, select the required table. Usually the data source for charts contains exactly one such table with the name of the chart.
Select whether you want to insert all columns or just a selection of them. If you choose the second option, you can select the desired columns in the displayed list.
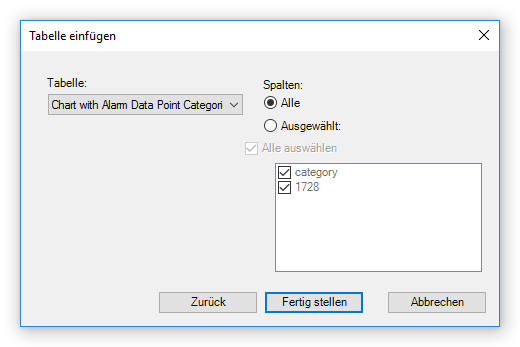
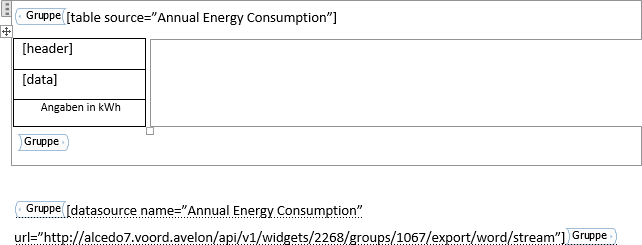
Click Finish. A group is automatically inserted into your template, which is filled with the tabular representation of the chart data when the report is generated. A second group is also created for the data source.
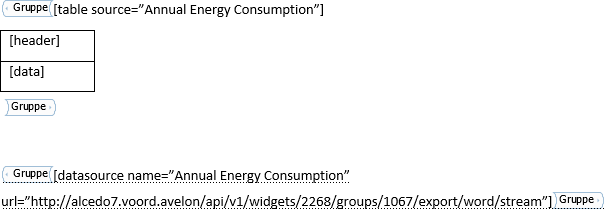
You can extend the inserted table by manually adding additional rows or columns. Such cells are adopted unchanged by Avelon Reporting. However, make sure that you do not change the command strings inserted by Avelon Reporting in square brackets, otherwise the automatic filling may no longer work.
Get and transform
Note
The following section describes how to insert table data from widgets into Excel reports. The documentation focuses on the latest version of Microsoft 365. The procedure may vary for older versions of Office.
Starting with Excel 2016, Avelon Reporting supports the query editor (“Get & Transform”). To use it, you must download the data in the appropriate format:
In the download window, click the Copy Link to Clipboard button next to the Excel Query option.
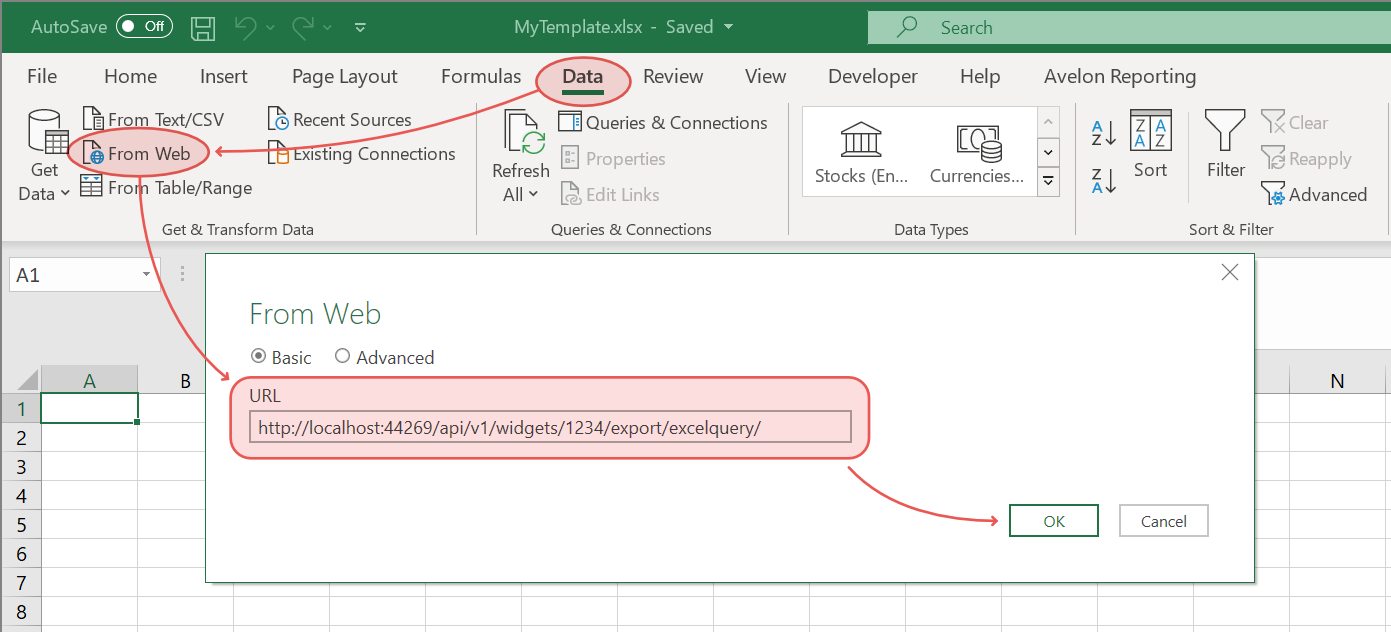
In the Excel ribbon called Data, click on From Web and paste the link you just copied from the clipboard into the URL field.
Warning
Make sure the URL ends with a
/.Click on OK.
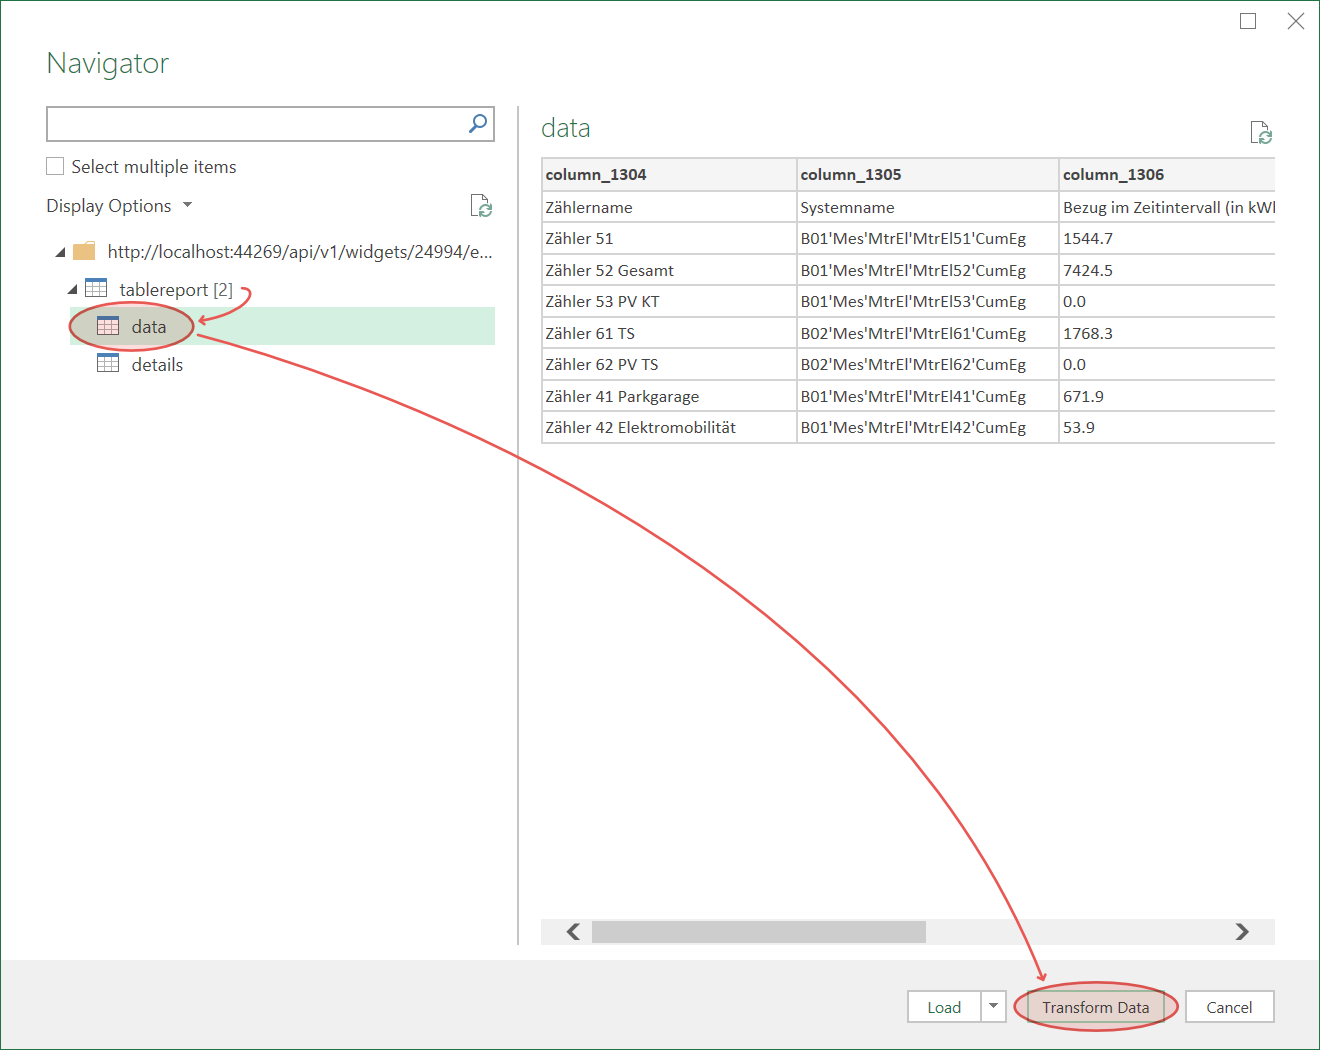
In the Navigator window, select the data node below the tablereport node. You should see a preview of your data on the right. Then click on Transform Data.
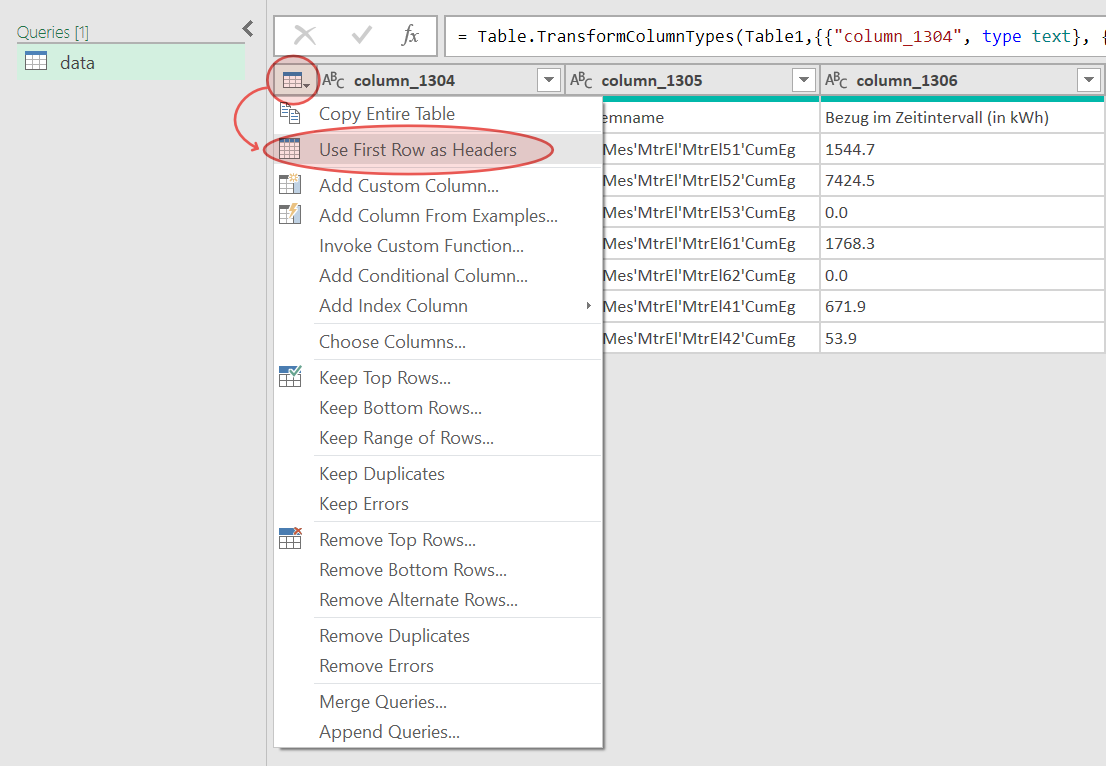
In the Excel query editor, you can then transform the data as you wish before inserting it into the worksheet. The first thing you might want to do is click on Use First Row as Headers, which is available either in the Home ribbon or in the little menu at the top left corner of the table. This will convert the first row into headers and also reformat the columns according to the infered data type (for example, columns containing numbers will automatically be converted to a numeric format).
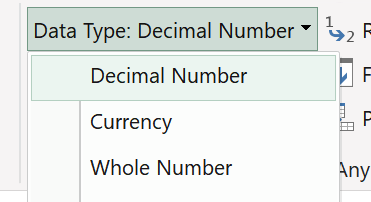
If a column contains decimal numbers but the values are not displayed correctly, make sure that the data type and locale are set correctly.
Click on the header of the respective column in the preview, then go to the Transform tab and change the Data Type to Decimal Number. If you’re asked for confirmation, click on Replace current.
Then add the parameter
"en-US"at the end of the transform function. We always export values with the.as the decimal separator, so using"en-US"ensures that decimal values are parsed correctly.Example:
If your initial transform expression is:
Table.TransformColumnTypes(Navigation, {{"datetime", type datetime}, {"value_1", Int64.Type}, {"value_2", Int64.Type}})
it should look like this after the changes:
Table.TransformColumnTypes(Navigation, {{"datetime", type datetime}, {"value_1", type number}, {"value_2", type number}}, "en-US")
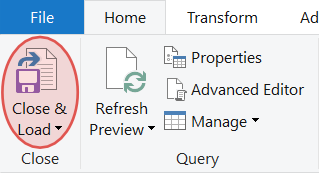
Note the
type numbertype cast for every decimal column and the locale parameter"en-US"at the end of the function call.If you’re done formatting the table, click on Close & Load in the Home ribbon to insert the data.
Warning
Some Power Query features may not be supported by Avelon Reporting. If you encounter problems when creating reports, try loading the data without transformations and then use normal formulas on the worksheets to transform the data if necessary.