Media flow
The media flow shows how a medium flows to a recipient (“consumer”) and is converted if necessary. For example, a heat pump draws electricity and converts it into cold or heat.
The media flow also calculates losses and indicates inconsistencies, e.g. if the outgoing power (the sum of the subordinate meters) is greater than the incoming power. The media flow can represent consumption with losses, and it can convert them into shares and costs.
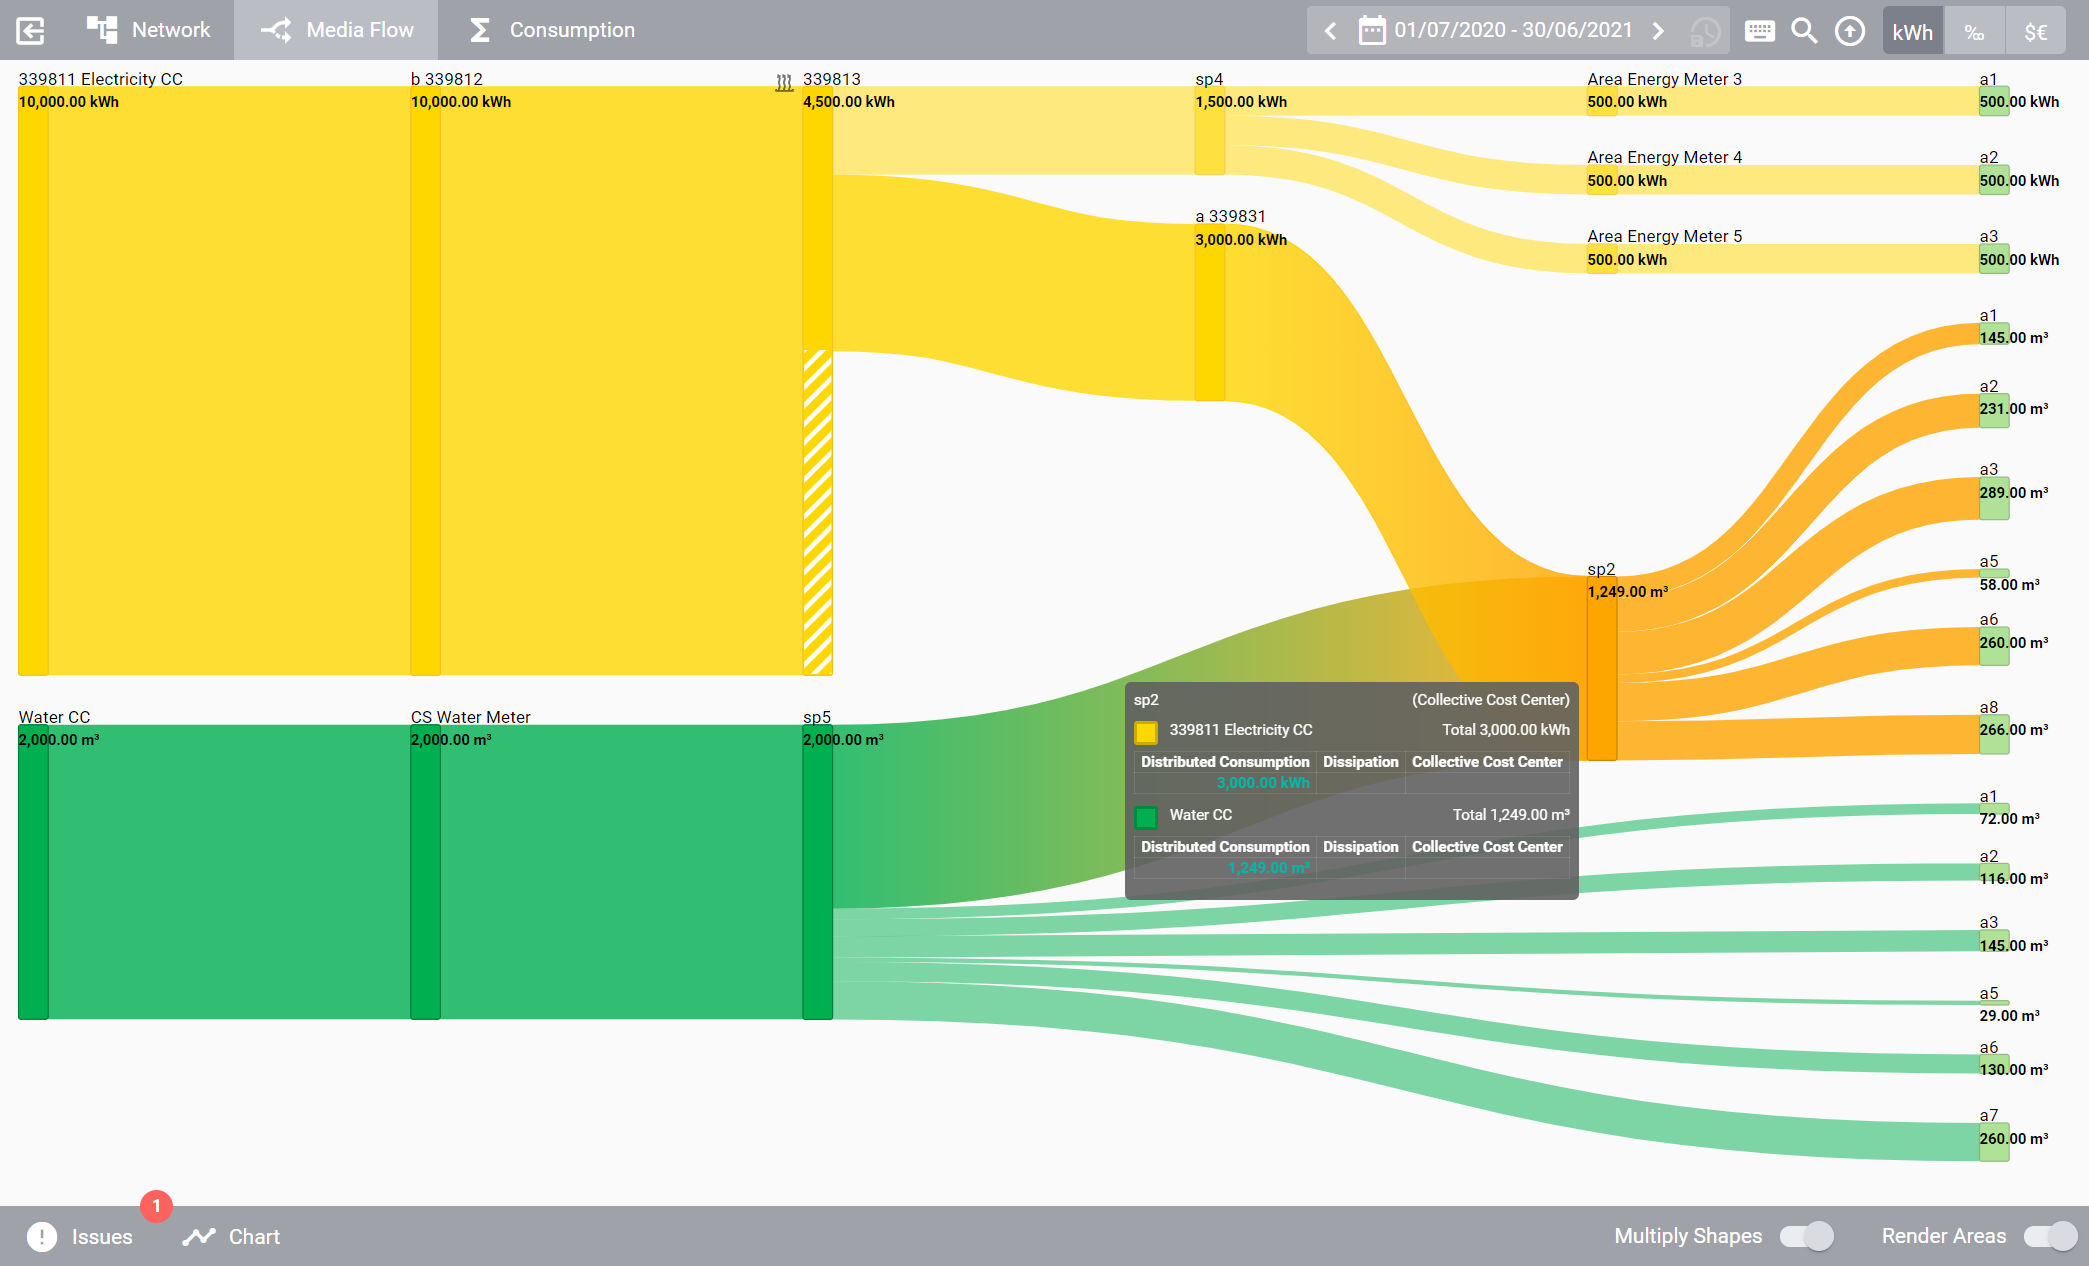
The media flow is based on the same network of cost centers, splitters, meters and areas that is configured on the Network tab. The flow is shown as a Sankey diagram, meaning the width of the arrows is proportional to the flow.
As on the Network tab, you can display the measurements of any meter in the network by clicking it.
If you hold Ctrl while clicking, only the elements are shown that are connected in some way to the selected element.
All other shapes will be temporarily hidden.
Click on Show All in the toolbar at the top right to show the entire media flow again.
Drag the view with the left mouse button to pan and press Alt while scrolling the mouse wheel to zoom in or out.
View options
At the bottom right you’ll find some options that can help you reduce the complexity of the media flow. They have no effect on the underlying calculation, though.
- Multiply Shapes
If enabled, area and area splitters will be duplicated if they have multiple connections to other objects. If disabled, only one shape will be displayed for each area or area splitter, and the connections will flow into the same shape instead. For performance reasons, an area splitter will be duplicated only if it is directly connected to areas, and only if the duplication will generate less than 500 shapes. Also note that if the connections that are flowing into an area splitter are coming from a common ancestor shape, the duplication algorithm will generate only one duplicated splitter for all these connections.
- Render Areas
If enabled, each area is displayed on the far left of the media flow. If disabled, these shapes are hidden, and the media flow stops at splitters or meters.
Detailed tooltips
If you hover over a shape, details about the media flow are shown in a tooltip.
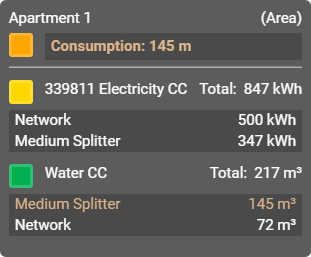
- Shape name and type
The name (top left) and type (top right) of the shape.
- Medium type and total consumption
The medium type and the total consumption flowing through this shape, including dissipation. The number is tinted in the color of the medium type. If the total consumption includes any kind of dissipation, it is shown separately on the same line.
- Cost center and total consumption
For each cost center connected with the selected shape, the name of the cost center is displayed on the left, with its share displayed on the right (including dissipation). The consumption of each cost centers is broken down into a list of collective cost centers and their individual shares. Consumptions contributing to the total consumption of this shape are tinted with the same color as the shape itself.
Note
If a shape is fed by multiple inputs, and the view option Multiply Shapes is enabled (see above), the amount that reaches the current duplicate of that shape is displayed in green.
Adjust size
The width and height of the media flow are calculated in such a way that the connections between the shapes have as little overlap as possible.
However, this can lead to big charts.
You can hold Shift and press any of the arrow keys to adjust the width and height of the media flow chart as you wish.
This can be helpful especially when you drilled down in the chart or when you want to download a chart of a certain size.
See Keyboard shortcuts.