Data source
Plots are usually based on the measurement values of a specific data point, which can be selected in the Data Point field.
You can also drag and drop a data point from the sidebar on the right to the Data Point field to assign it to the plot.
However, most charts also support plots with a dynamic data source that pick data points automatically based on some filter criteria.
- Data Source
- Data Point
The plot is based on the measurement values of a specific data point.
- Dynamic
Plots are created dynamically based on the data points that match the given filter criteria below and filter settings from the Filters panel.
Data point
If Data Source is set to Data Point or the plot only supports single data points, you can configure the respective data point in the Data Point field.
You can replace the data point at any time by dragging another data point from the data point gallery in the sidebar on the right to the input field.
Dynamic
If Data Source is set to Dynamic, you can configure the filter criteria for the data points that should be used.
- Data Type
Select the data type of the data points you want to use for the plot.
Note that the option “(None)” filters all data points that don’t have a data type assigned. If you want to include all data points regardless of their data type, select “(No Filters Selected)” instead.
- Data Point Tags
Select the data point tags that should be used to filter the data points.
If you select multiple tags, you can choose whether the data points should match all or any of the selected tags by clicking on And or Or, respectively.
- Medium Types and Usages
Select the medium types and medium type usages that should be used to filter the data points. If a data point has any of the selected medium types or usages, it will be included in the chart.
- Group Tags
Select the group tags that should be used to filter the data points. If a data point has been assigned to a group with the selected group tag, it will be included in the chart.
If you select multiple tags, you can choose whether the groups need to match all or any of the selected tags by clicking on And or Or, respectively.
- Groups
Select the groups (e.g. buildings, real estates or portfolios) that should be used to filter the data points.
If a data point has been assigned to any of the selected groups, it will be included in the chart.
The number of data points that can be filtered dynamically is limited to 50 per plot. If more than 50 data points match the filter criteria, the plot won’t be displayed, and you’ll have to select more restrictive filter criteria to reduce the number of data points.
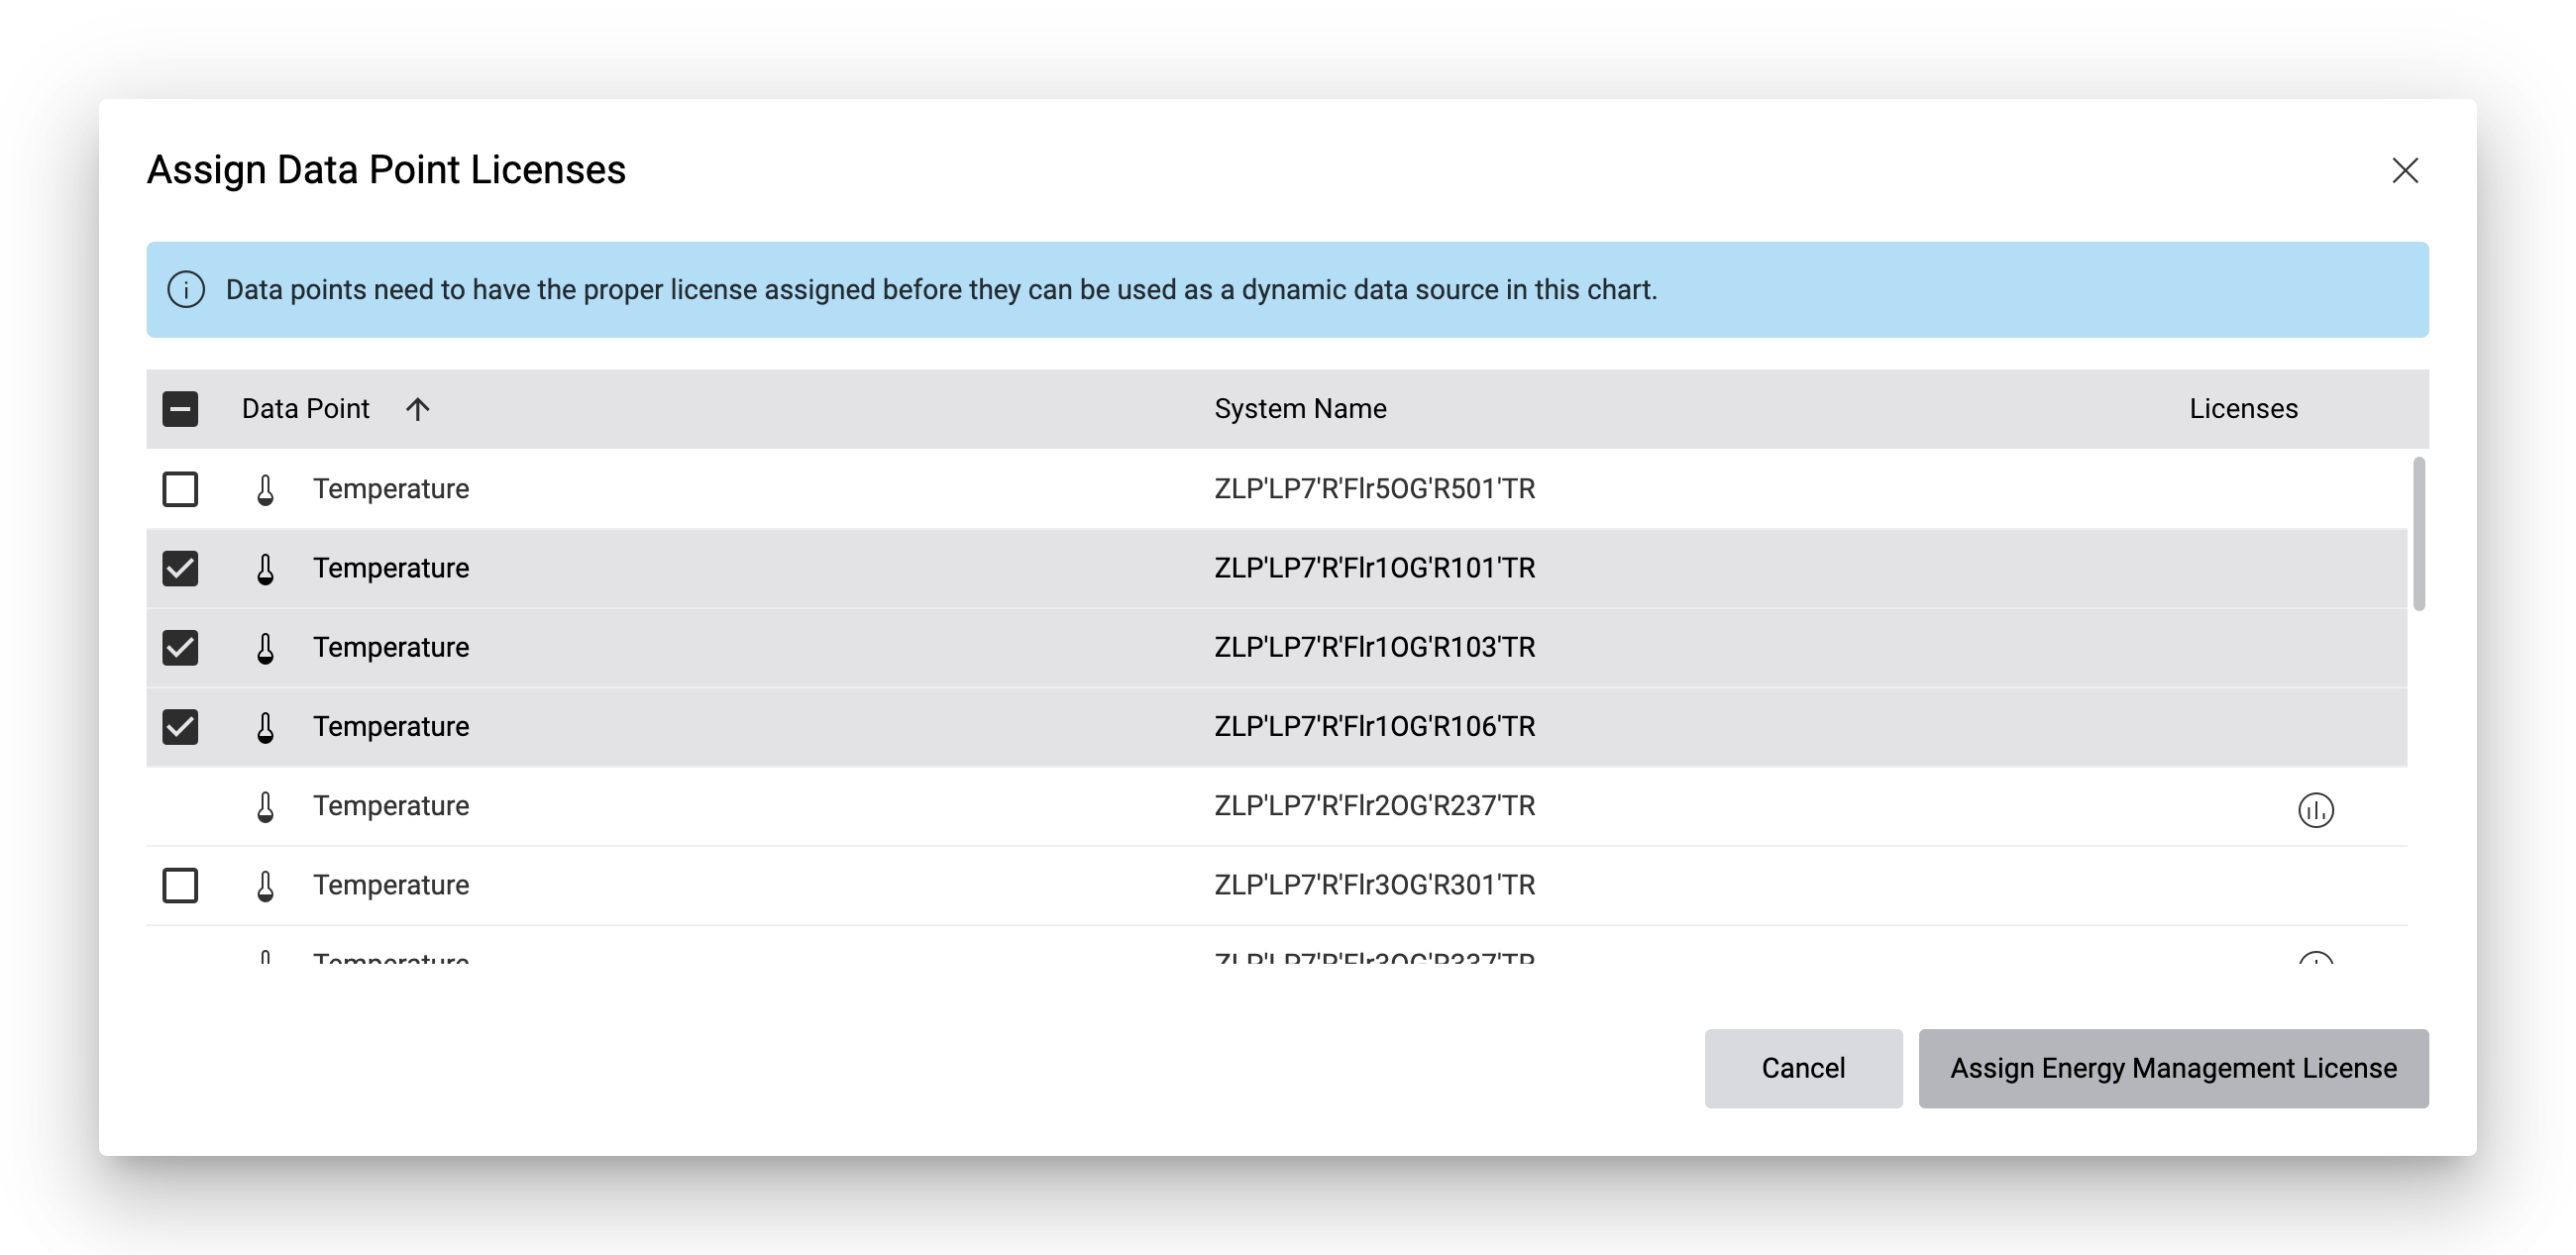
Also note that only data points that have the necessary licenses are taken into account on dynamic plots. Data points must either have an “Operate” or “Energy Management” license assigned, depending on the chart type. To assign licenses, click on the Assign Licenses button below the filter selection. In the following dialog, you can see which data points match the current filter criteria. Select the data points you want to use in your plot and click on Assign Operate License or Assign Energy Management License to assign the respective license to the selected data points. Data points that are not selectable already have the necessary licenses assigned.

If you want to remove licenses from data points, change the filter criteria so that the data points are no longer included in the plot. This will automatically remove the licenses from the data points.
Plots with dynamic data sources can be further filtered by the Filters panel on the dashboard. Unlike the settings on the chart, which affect all users, the filters in the filters panel are user-specific and are only applied for the logged-in user. This allows you to create BI reports quickly without having to create separate charts or modify existing charts.
Mass data point function
If you’ve selected Dynamic as the data source as described above, several data points can match the filter criteria.
Under Mass Data Point Function, you can define how the values of the different data points should be combined.
- Sum
The values of the different data points are summed up.
- Average
The average value of the different data points is calculated.
- Minimum
The minimum value of the different data points is calculated.
- Maximum
The maximum value of the different data points is calculated.
Note that this aggregation is applied _after_ the primary data function, where the values of the individual data points are aggregated in time.
The primary data function is applied to each individual data point. Consumption calculations are based on the measurement type.
The mass data point function is applied to the resulting values from the primary data function.
The secondary data function is applied to the resulting values from the mass data point function.