Condition mask
Condition masks are used so that measurement values are only taken into account in a chart if they fulfill a certain condition.
Condition masks are available in the following chart types:
Duration Curve
Savings Gauge
Pie Chart
Scatter Chart
Carpet Plot
Chart with Aggregation Functions or Data Point Categories
How to configure a condition mask for a chart:
Switch to edit mode in the chart concerned and select the plot for which you want to define a condition mask.
Select the Condition Mask option in the plot settings.
Drag a data point from the data point gallery onto the area labeled Data Point.
You can use the settings Comparison Operation and Comparison Value to define the condition of the data point.
Values of the plot data point are now only taken into account in the chart if the condition applies for the condition data point.
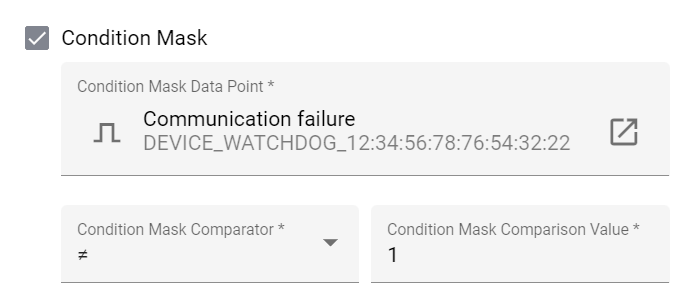
With the condition mask above, the measurements of the plot data point are only taken into account when the assigned binary data point is not 1.