Edit shapes
Create shapes
Navigate to the desired shape group in the left sidebar and then click Add at the top in the action bar and then Add Shape. Enter the name of the new shape in the following dialog. If your shape will only contain a single data point, check the option Single Data Point Shape. For more information about this option, see Object Types in the Shape Library. If the menu items are disabled, please select a shape group first.
Warning
Please note that modifying the shape library will clear the change history of all schematics in your client account. This means that you will no longer be able to revert changes that were made on the schematics prior to the modifications in the shape library.
Edit shape groups
If you select a shape group in the left sidebar, you can edit the following settings of that group:
- Name
The name of the shape group as it appears in the shape library. Use the Edit Translations button to change the name in multiple languages.
- Deprecated
Marks a shape group as deprecated or obsolete. This is to inform users that the shapes in this shape group are no longer to be used in production systems and will be removed from the shape library in the future. Deprecated shape groups and shapes therein are displayed as strikethrough in the shape library sidebar.
Edit shape
If you select a shape in the left sidebar, the visual appearance and behavior of the shape can be configured on the right side of the screen.
General properties
- Name
The name of the shape as it appears in the shape library. Use the Edit Translations button to change the name in multiple languages.
- Deprecated
Marks a shape as deprecated or obsolete. This is to inform users that the shape is no longer to be used in production systems and will be removed from the shape library in the future. Deprecated shapes are displayed as strikethrough in the shape library sidebar.
- Show Status Icons
Status icons relating to manual intervention and alarm status are automatically displayed to the right of the shape on the schematic. If you prefer to replace these default symbols with your own visualizations, you can deactivate this option and configure SVG code and behavior rules yourself instead (see Visualize manual mode and alarm status of linked schematics).
- Open Faceplate on Click
By default, the faceplate will be displayed when the user clicks on the shape on the schematic, where individual data points are displayed and can be edited by the user. You can disable the faceplate by unchecking this option. This is useful for purely decorative shapes that are not supposed to display any information or offer any interactions, but it can also be used for more complex shapes where only certain areas of the shape should write a specific value to the data point without showing a faceplate, such as buttons, sliders or room automation shapes.
Note that the faceplate will not be displayed if the entire shape is covered by an element that has an “On click”, “On press” or “On slide” action, regardless of this option.
- Equipment Identification (System Name Prefix)
On most shapes, the system names on the individual behavior rules share a common prefix that identifies the equipment the shape represents. In order to avoid retyping the same prefix on all behavior rules, you can set this value to the common system name prefix. The value should be a valid regular expression and will be prepended to the system name expression on each individual behavior rule below. This has no effect on the actual functionality of the shape, but it speeds up the process when creating or modifying behavior rules, since this part of the system name doesn’t need to be repeated on each behavior rule manually.
- Schematic Usage
Displays a list of all the schematic widgets on which the corresponding shape has been placed. Click on an entry in the list to jump directly to the corresponding schematic.
Shape preview and simulator
A preview of the shape is displayed on the left-hand side of the shape settings. By default, it will show the SVG code as defined on the Code tab. If you click on Start Simulator or enter a test value in the grid below, the test values will be applied to the shape according to the behavior rules.
The preview also offers some handy view options to test your shape:
Show View Box |
Shows the view box of the shape, i.e. the position and dimension of the SVG viewport. |
Show Connection Stubs |
Shows the connection stubs, i.e. small triangles that indicate the position and orientation of places from where connections can be drawn. See Shape connection stubs. |
Preview in Dark (or Light) Mode |
Toggles between light and dark mode, allowing you to preview the shape in both modes quickly. Please consider using context-aware colors to ensure the best possible contrast of shapes in both modes. When you leave the shape editor, the mode will be reset to the one configured in your user account. |
Rotate |
Rotates the preview by 90° increments. This rotation only affects the preview, not the actual shape. |
Edit the SVG code of a shape
Above the shape settings, to the right, click on Code to display the SVG source code of the shape. To edit the visualization of the shape, you can edit the SVG code directly in the text field or copy and paste it from third-party applications such as Adobe Illustrator, Affinity or Inkscape.
You can toggle automatic line wrapping in the code editor by clicking on Wrap Lines.
Note
This manual assumes a basic knowledge of SVG. A short introduction can be found under SVG reference.
In order to animate certain elements using behavior rules in dependance of measurements or properties or the current data point, they must first be uniquely marked. You do this by assigning a unique ID to the corresponding elements in the SVG code:
<path id="Background" fill="#ED145B" d="M10,0L20,20H0L10,0z" />
<path id="OperationState" fill="#FFFFFF" d="M10,5L15,15H5L10,5z" />
Warning
The IDs LinkedAlarmStatus, LinkedManualMode and ShapeLabel are reserved IDs with a special meaning.
You can read more about this in the section Visualize manual mode and alarm status of linked schematics and Automatically display shape label in shape.
Edit the behavior rules of a shape
How to animate shapes with behavior rules is described in the chapter Shape behavior.
Visualize manual mode and alarm status of linked schematics
For linked shapes, the states Manual Mode and Alarm of the link target can also be visualized. The link target is usually another schematic or a group.
First switch to the code view of the shape and create the desired visualization (for example, a path or group of elements). Give the element or group one of the following ID attributes so that it is only displayed when the corresponding state occurs:
- LinkedManualMode
The element is displayed if one of the data points placed in the shape is set to Manual Mode.
- LinkedAlarmStatus
The element is displayed if one of the data points placed in the shape is set to Alarm.
Examples
<path id="LinkedAlarmStatus" fill="#ED145B" d="M10,0L20,20H0L10,0z" />
<g id="LinkedManualMode">
  <circle fill="#CCCCCC" cx="10" cy="10" r="10" />
  <circle fill="#FFFFFF" cx="10" cy="10" r="5" />
</g>
Warning
Use each of these special IDs no more than once per shape.
Automatically display shape label in shape
Set the id attribute on a <text> element in the SVG source code to ShapeLabel so that the text is automatically set to the label of the corresponding shape when the shape is placed on a schematic.
You can set the Label of a shape individually for each shape placed on the schematic using the Properties sidebar.
Example
<text id="ShapeLabel" x="50" y="10" fill="black" text-anchor="middle" />
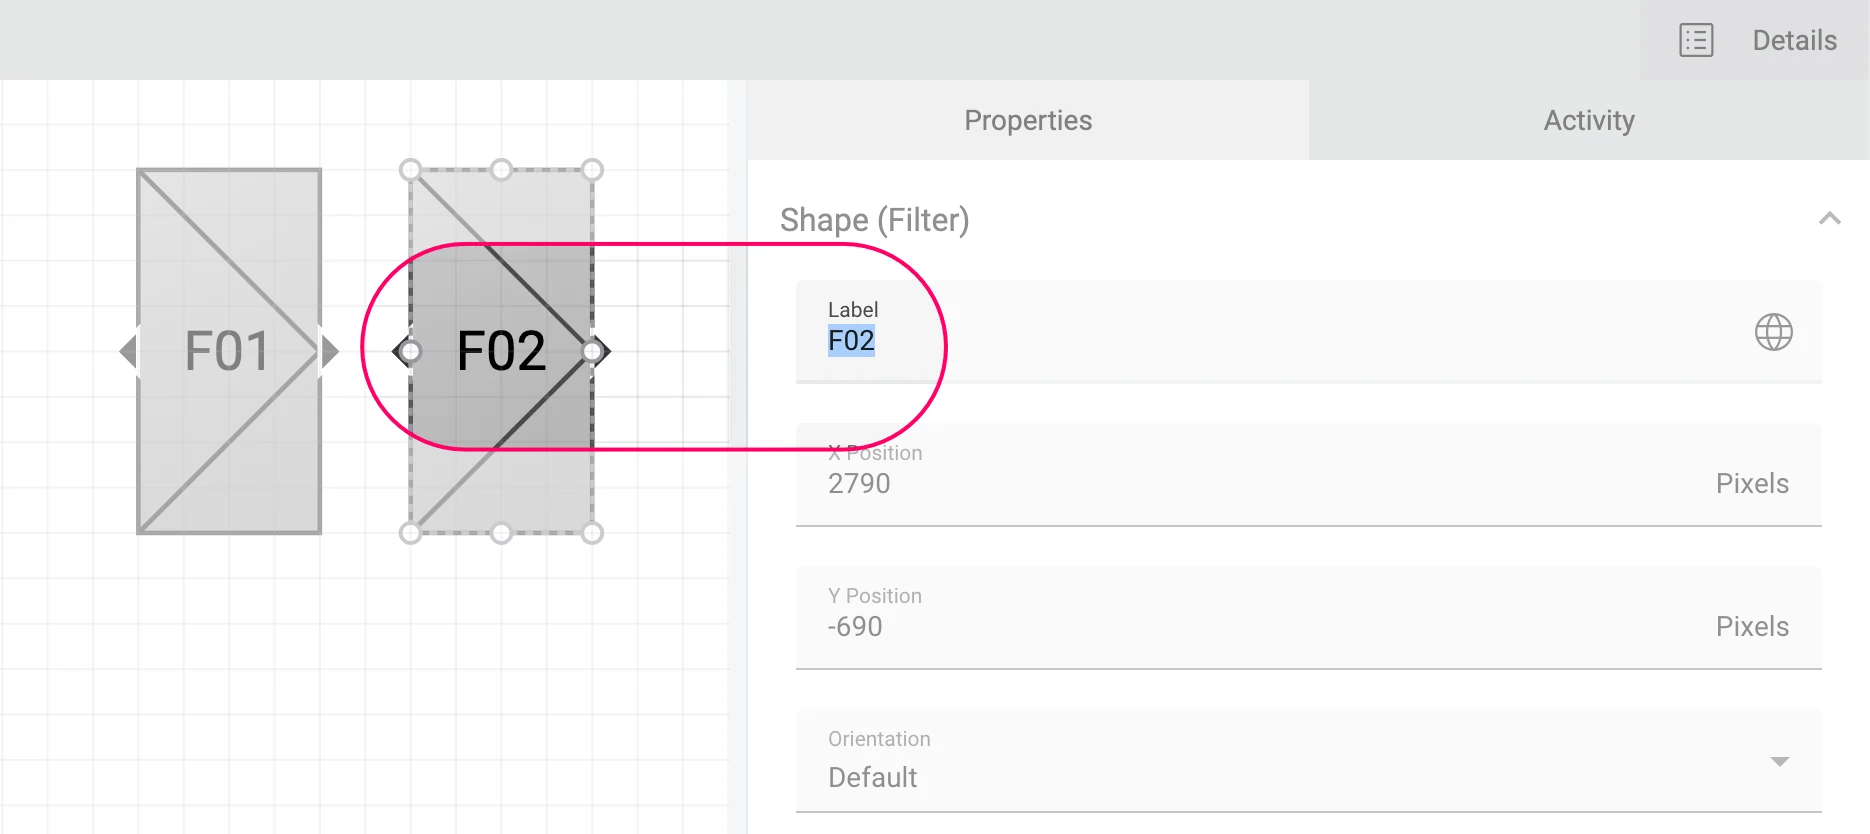
The same shape with two different labels, which can be set in the Properties sidebar of each shape individually.
Warning
Use this special ID only once per shape.
Shape connection stubs
In order to be able to connect the shape in the schematic with other shapes with a visual connection line, you must define corresponding connection points on the shape. These are indicated by small arrows in the shape editor and in the editing mode of the schematic.
Each connection stub has a position and a direction and can be connected to any number of shapes on the schematic.
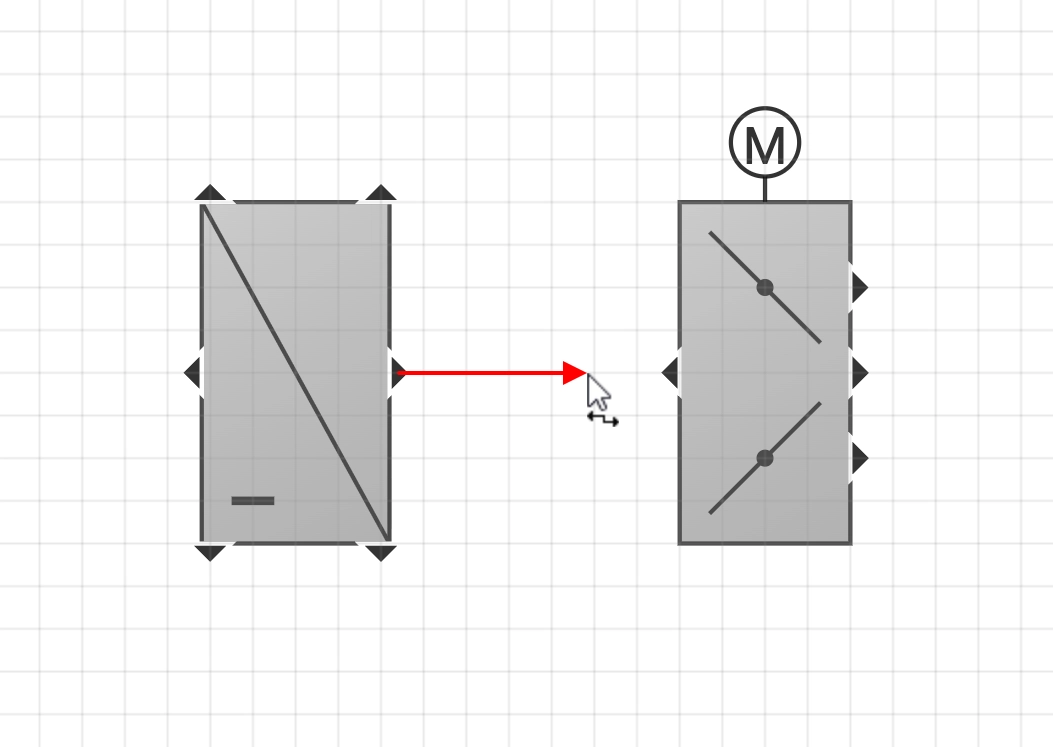
The connection points are defined with a <stub> tag at the beginning of the SVG inside the <defs> element.
These are technically not part of the SVG specification and are only shown when you toggle them on via the option Show Connection Stubs in the preview area.
Each <stub> element has the following attributes:
|
x-coordinate of the anchor position |
|
y-coordinate of the anchor position |
|
The direction in which the connecting line leaves the shape.
Permitted values are |
To determine the coordinates for your connection points, you can hover over the shape preview. The coordinates below the mouse cursor will be displayed in the bottom right corner of the shape preview.
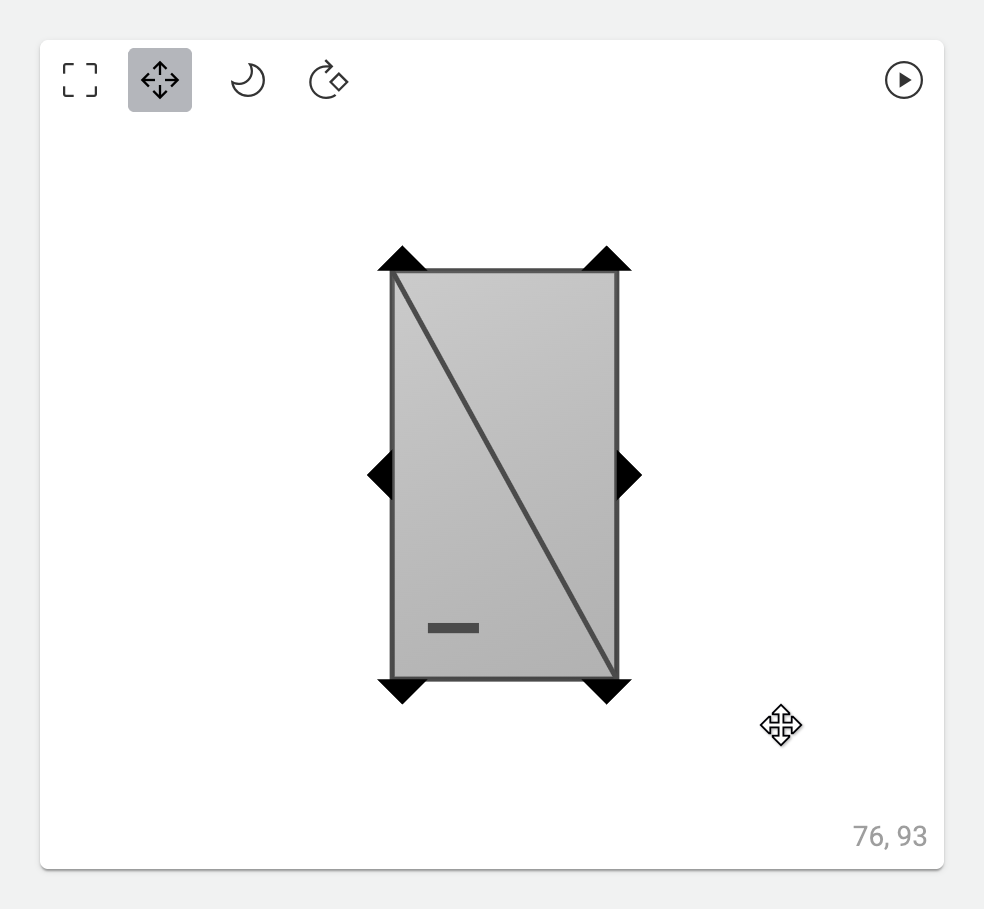
After toggling the Show Connection Stubs options at the top left, the connection stubs are displayed on the shape. At the bottom right you can see the current mouse coordinates relative to the shape.
Example
<svg version="1.1" id="AvelonVentilationCrossFlow"
     x="0px" y="0px" width="100px" height="100px" viewBox="0 0 100 100">
  <defs>
    <stub direction="left" x="0" y="50"></stub>
    <stub direction="right" x="100" y="50"></stub>
    <stub direction="up" x="50" y="0"></stub>
    <stub direction="down" x="50" y="100"></stub>
  </defs>
  <!-- Visual elements -->
</svg>
Warning
Note that the order of the <stub> elements is critical.
If you have placed a shape on a schematic and connected it to other shapes and then remove, rearrange or add additional <stub> elements, this can have unforeseen effects on existing connections.
Therefore please be certain to check all previously placed shapes and their connections after a change.
Note
By default, shapes on the schematic widget are aligned to a grid of 10 by 10 pixels, and stubs on the default shapes are usually located at coordinates that are multiples of 10. We therefore recommend to place the connection points in your shapes at coordinates that are multiples of 10 too, to ensure that the connecting lines are always properly aligned.
Context-aware colors
By default, colors defined in the shape’s SVG code are static. As long as all elements of a shape are placed on an element with a solid fill, this is okay for most use cases. However, if elements such as texts or thin lines are not placed on elements with a solid fill, they might not look as expected if the user places the shape on a schematic with a dark background color, or if the user has dark mode enabled.
To fix issues like these, you can add one of the following CSS classes to your elements to have them change color depending on their context.
|
Automatically sets the fill color of the element to the current theme color. |
|
Automatically sets the stroke color of the element to the current theme color. |
|
Automatically sets the fill color of the element to the appropriate contextual contrast color. |
|
Automatically sets the stroke color of the element to the appropriate contextual contrast color. |
Note
theme-fill and theme-stroke reflect the current theme color (dark or light).
If the background of the schematic is set to a fixed color, however, they will adapt accordingly, appearing dark on dark backgrounds and light on light backgrounds.
contrast-fill and contrast-stroke will take on a contrast color, appearing light on dark background and dark on light backgrounds, respectively.
If you’re working in light mode and create text elements with a black fill color (left), these might become almost invisible for users who use dark mode (right). Also note how the square boxes with the subtle borders turn into unsightly blocks in dark mode, because their colors are set statically:
By replacing the static fill fill="..." of your text elements with the dynamic CSS class class="contrast-fill", the system ensures that the text is always displayed with the correct contrast color, depending on the current mode.
Similarly, use class="contrast-stroke" for the stroke of rectangles or other elements to ensure that their outline is displayed with the correct contrast color as well:
Example
<text x="0" y="0" class="contrast-fill">Context-aware text</text>
<line x1="0" y1="0" x2="100" y2="100" class="contrast-stroke" stroke-width="1"/>
<rect x="0" y="0" width="100" height="100" class="theme-fill contrast-stroke" stroke-width="1"/>
Do not add an explicit fill attribute when using theme-fill or contrast-fill, nor an explicit stroke when using theme-stroke or contrast-stroke, as these might conflict with the context-aware colors.
Note
While custom SVG-based shapes support dynamic context-aware colors via CSS classes as described above, simple shapes like Text shapes and geometric shapes like Rectangle, Ellipse, Line, or Polygon shapes work slightly differently.
Text shapes will automatically adapt their color to the current mode by default, unless a specific color is set on the shape.
Geometric shapes don’t automatically adapt to the current mode, but you can enable it if needed by checking the option Adapt Brightness Automatically in the Properties sidebar of the shape. For more information about this option, see Colors.
Fixed elements
If you want to add elements to your shape that are not affected by the rotation of the shape on the schematic, you can add the attribute fixed="true" to the corresponding elements in the SVG code.
Example
<rect x="0" y="0" width="100" height="100" fill="none" class="contrast-stroke"/>
<path d="m 100 100 h -100 l 50 -50 z" class="contrast-fill contrast-stroke" fill-opacity="0.1"/>
<rect x="40" y="15" width="20" height="20" class="contrast-fill contrast-stroke" fill-opacity="0.1"/>
<text x="50" y="29" text-anchor="middle" class="contrast-fill" fixed="true">ΔT</text>
If you want multiple elements to be fixed, you can also group them together in a <g> element and add the attribute to the group.
<rect x="0" y="0" width="100" height="100" fill="none" class="contrast-stroke"/>
<path d="m 100 100 h -100 l 50 -50 z" class="contrast-fill contrast-stroke" fill-opacity="0.1"/>
<g fixed="true">
  <rect x="40" y="15" width="20" height="20" class="contrast-fill contrast-stroke" fill-opacity="0.1"/>
  <text x="50" y="29" text-anchor="middle" class="contrast-fill">ΔT</text>
</g>
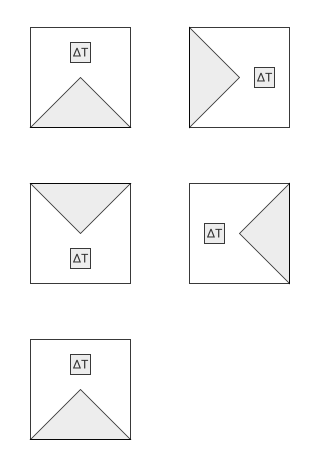
Note how the text inside the small rectangle remains the right way up, even when the shape is rotated.