Setpoint curve
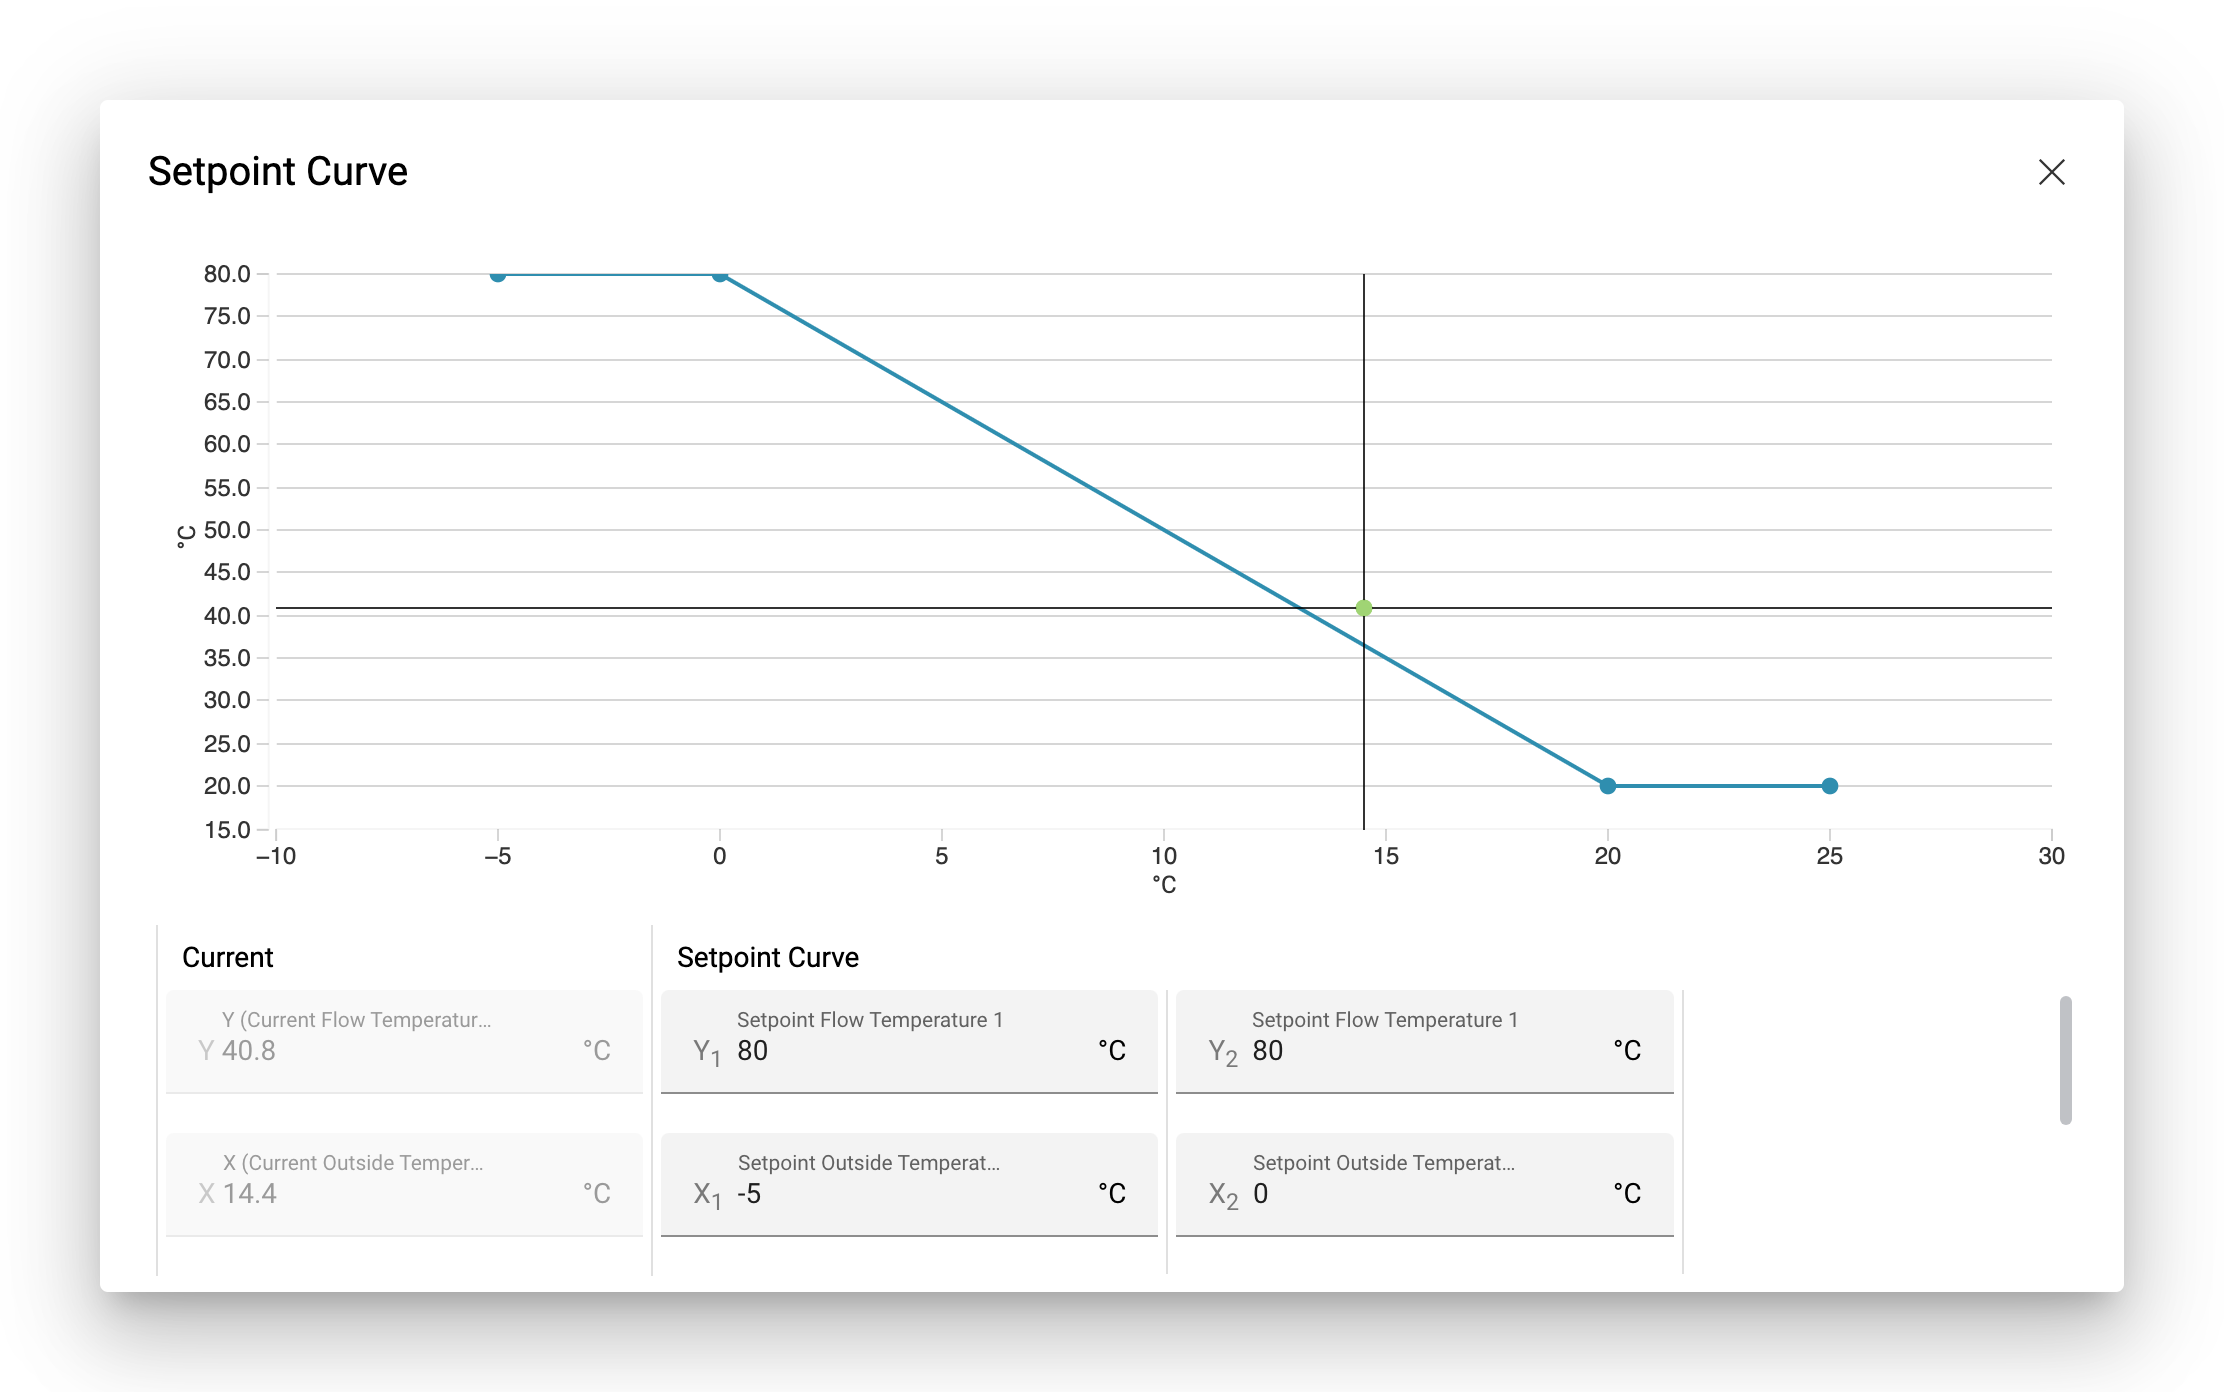
With the setpoint curve, you can display a piecewise linear curve that represents the desired operating or flow temperature in relation to the outside temperature. By plotting the current flow and outside temperature on the chart, you can check how closely the current values follow the setpoints.
To configure a setpoint curve, place a Chart shape from the toolbar on the schematic and select it.
Open the Library sidebar on the left and make sure you’re on the Data Points tab.
Open the Properties sidebar on the right and scroll down to the Chart section.
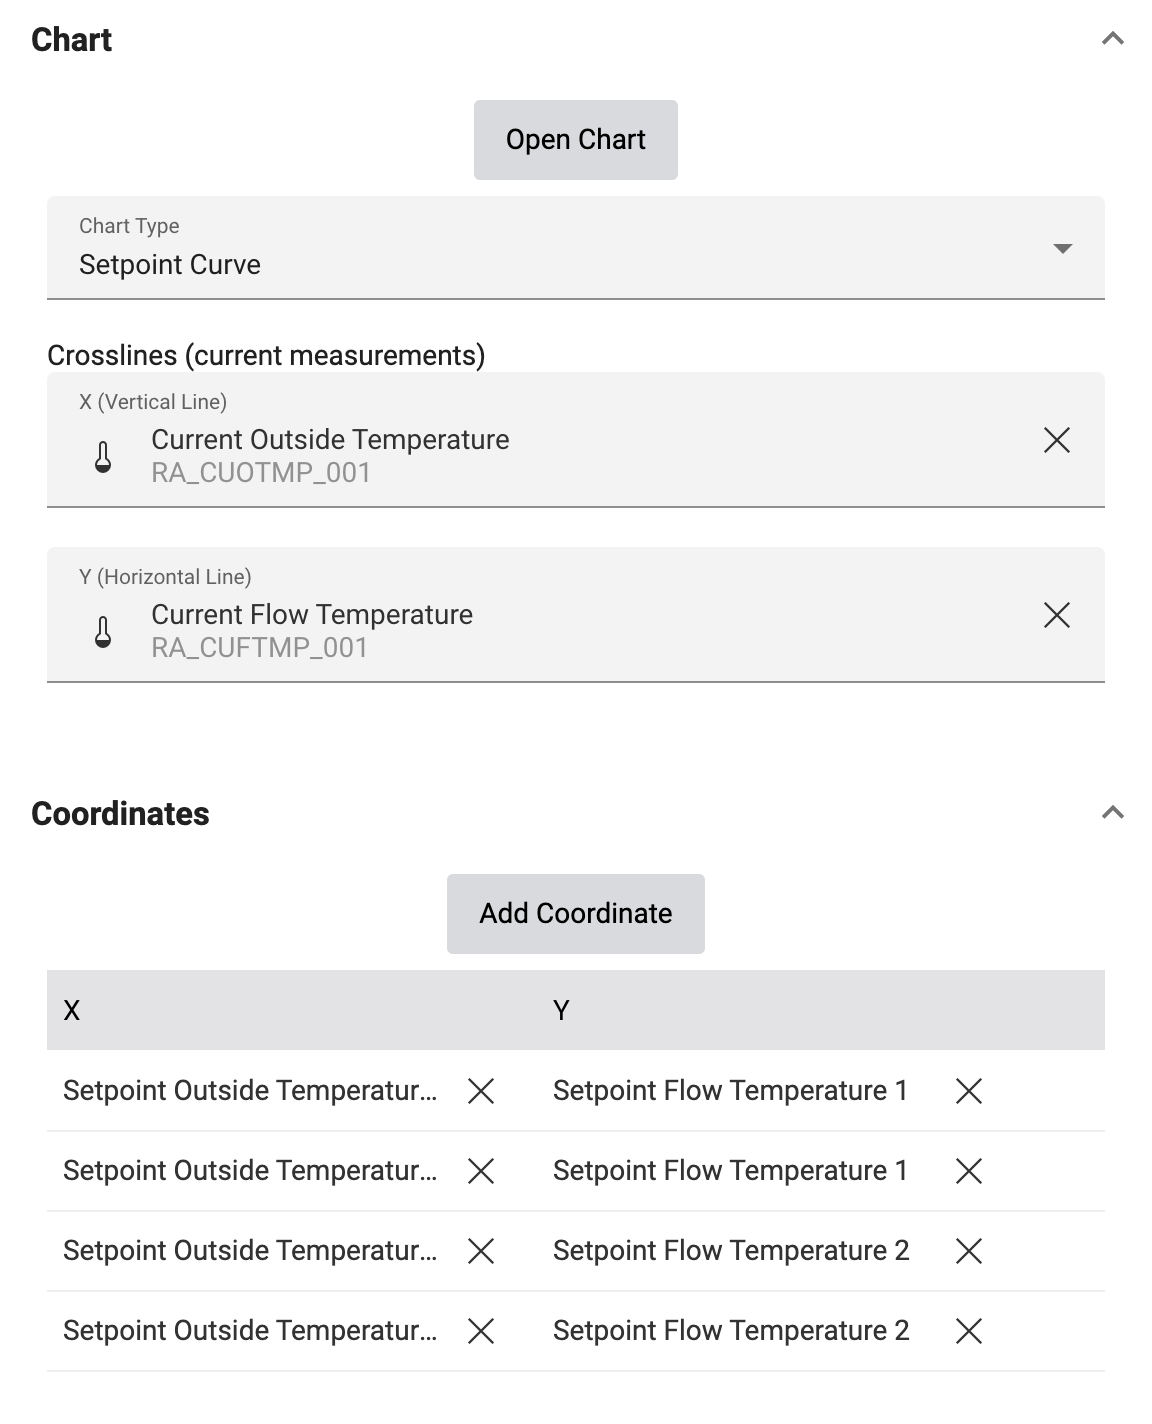
Make sure that Chart Type is set to Setpoint Curve.
Now drag the data point representing the current outside temperature on the X (Vertical Line) input field, and the data point representing the operating or flow temperature on the Y (Horizontal Line) input field.
Under Coordinates, click on Add Coordinate. Then drag the data point representing the first (lowest) outside temperature setpoint on the empty slot in the X column, and the data point representing the first (lowest) operating or flow temperature setpoint on the empty slot in the Y column.
For every other coordinate of the setpoint curve, repeat step 6.
If you want to reuse your schematic and have the setpoint curve automatically filled with different data points depending on the page from which the schematic was opened (see dynamic links), you can enter a regular expression that matches the data point’s system name. If the system finds a data point in the data point filter from the invoking link shape whose system name matches the regular expression, it will automatically be assigned when the schematic is loaded.
Note that fixed values are not supported in this table. Even if you want to set a specific X or Y coordinate to a fixed value, you still need to create a data point, add a new measurement value to this data point with the desired fixed value, and assign this data point to the respective cell in the grid.
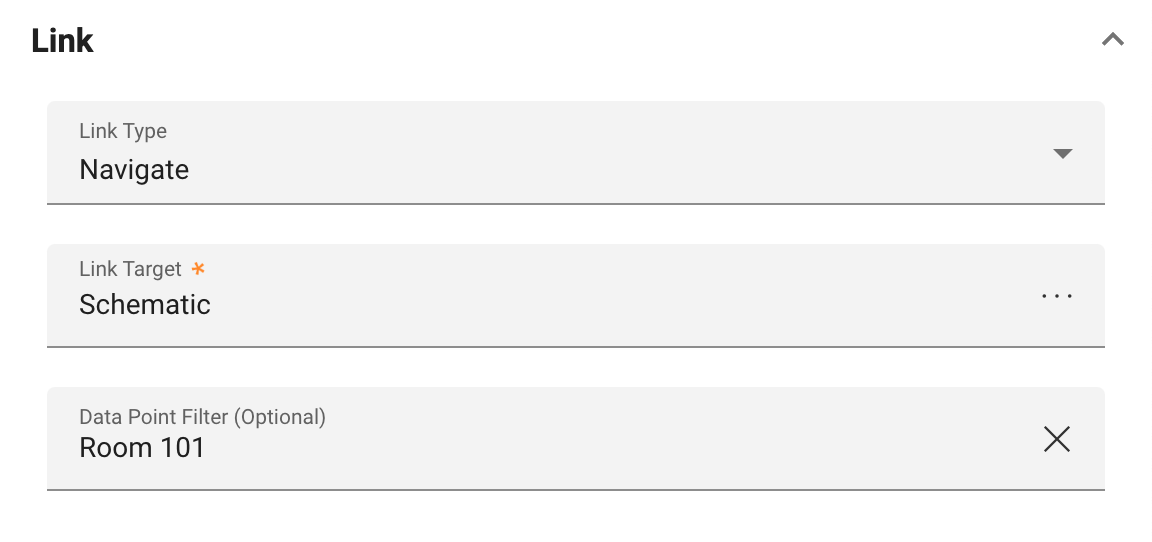
Afterwards, you can open the schematic by configuring a link on the shape of another schematic, select the link type Navigate and the schematic you want to open, and assign a data point filter. If the user clicks on the link shape to open the schematic, the system will automatically assign the appropriate data points that are present in the assigned data point filter and match the system name you entered in the coordinates cell.
Comfort chart
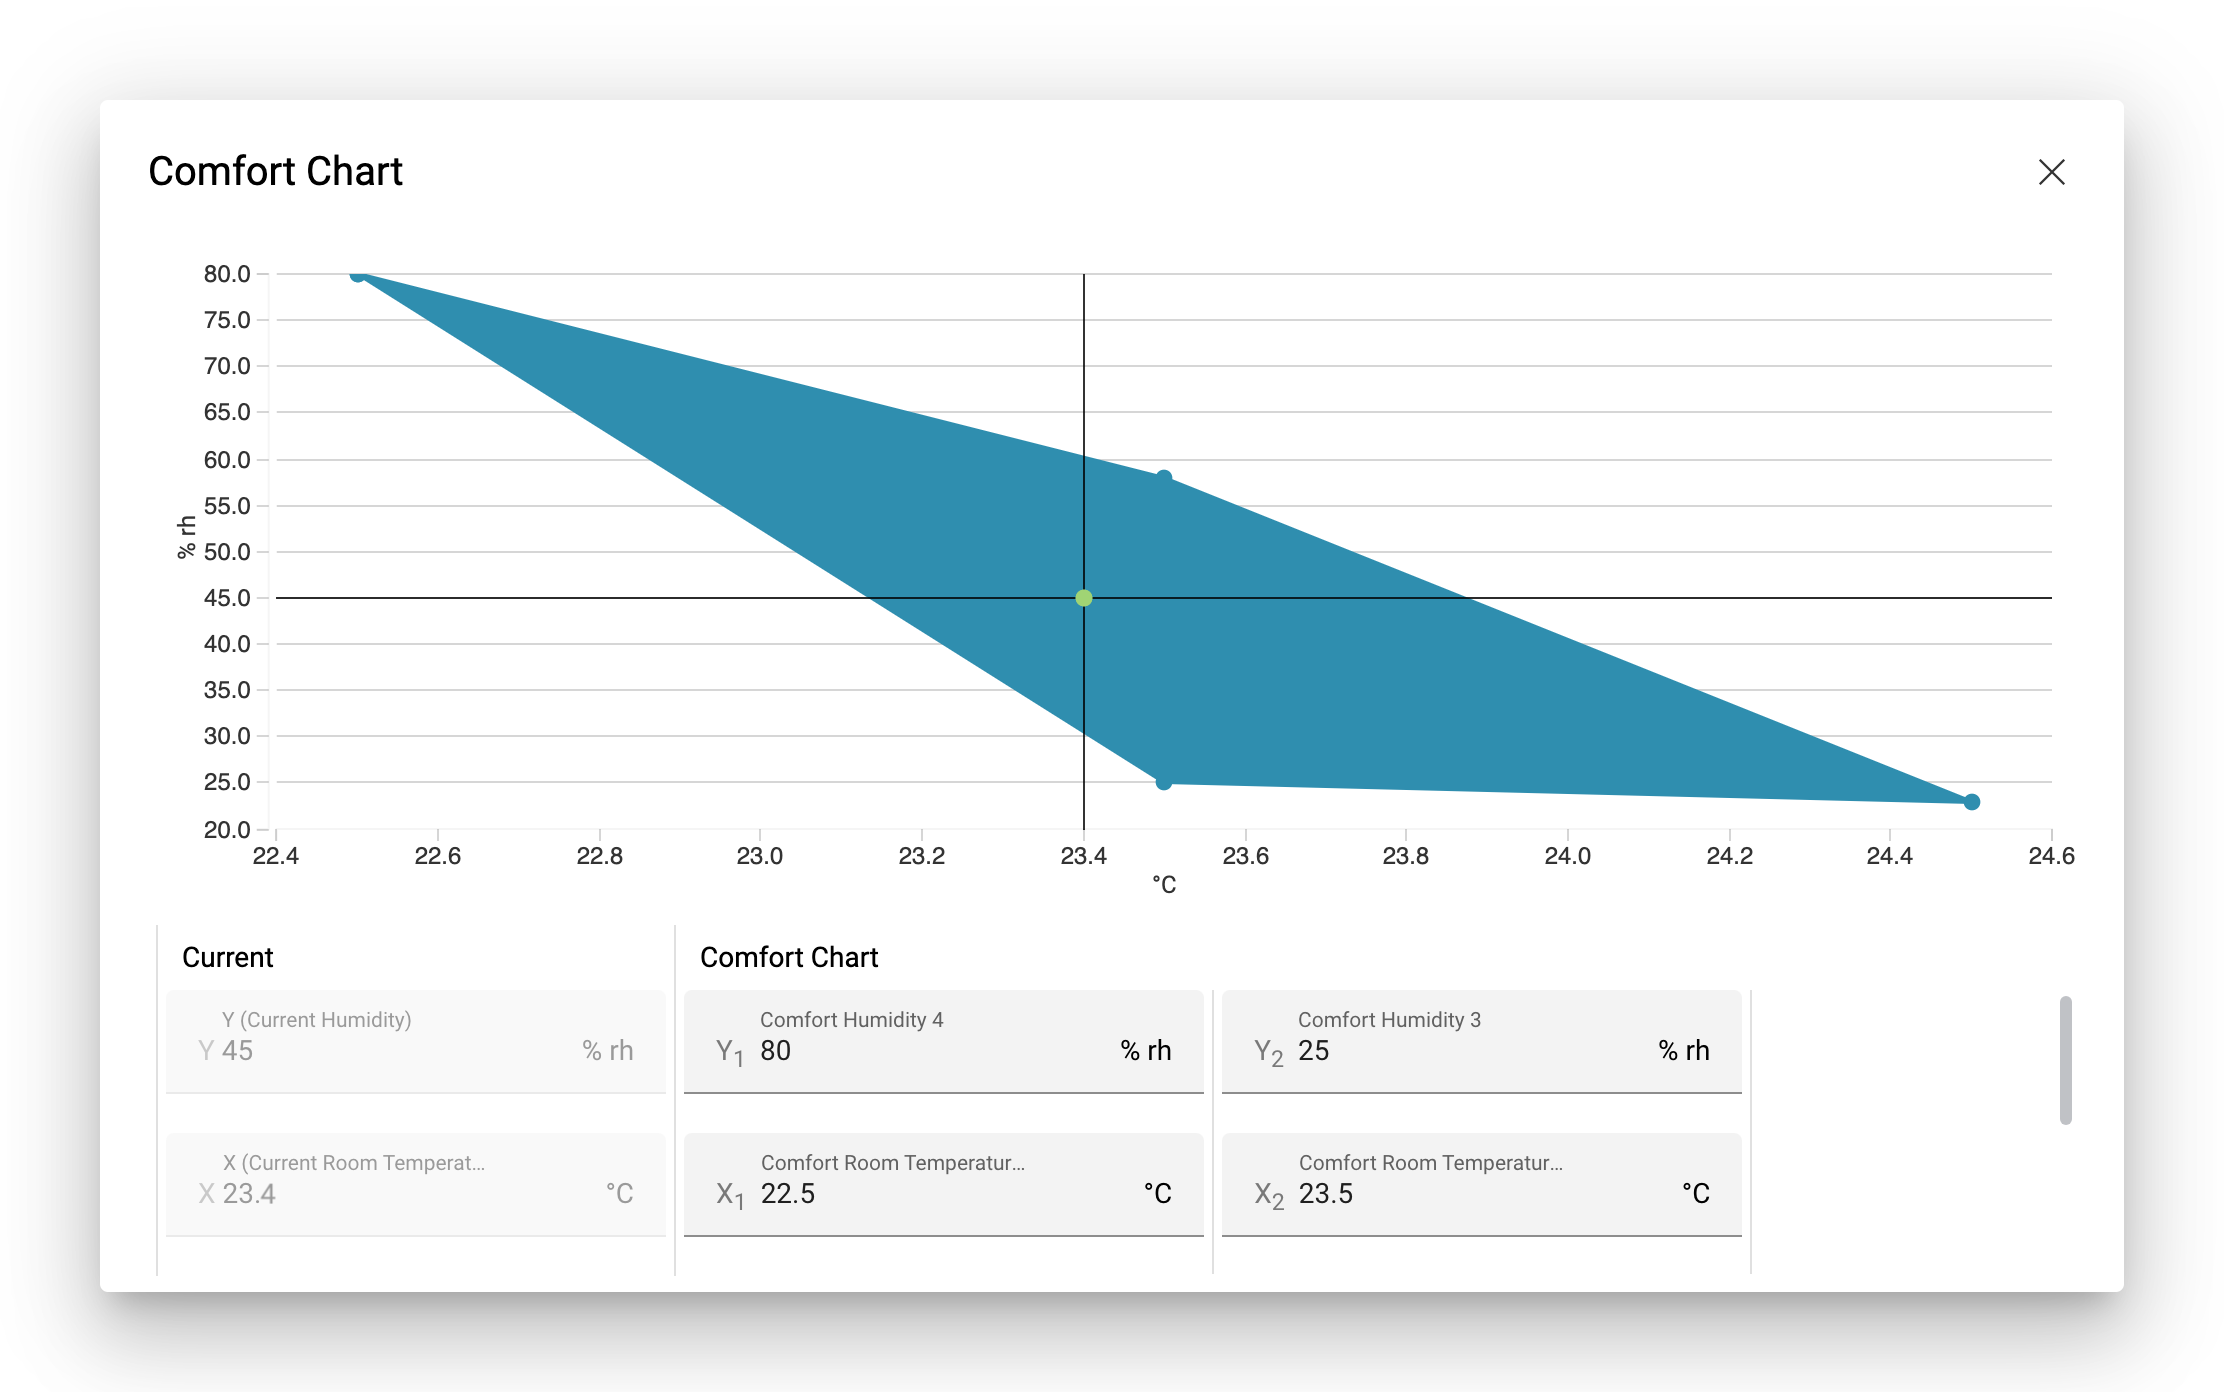
With the comfort chart, you can display an area plot that represents the zone in which the relation between room temperature and humidity is comfortable for human beings. By plotting the current room temperature and humidity on the chart, you can check whether the current values are still inside the comfort area.
The area on the comfort chart is usually shaped like a diamond, and each of the four corners is determined by the minimum and maximum room temperature and its corresponding minimum and maximum humidity value that represent the edge between comfortable and uncomfortable room climate.
To configure a comfort chart, place a Chart shape from the toolbar on the schematic and select it.
Open the Library sidebar on the left and make sure you’re on the Data Points tab.
Open the Properties sidebar on the right and scroll down to the Chart section.
Make sure that Chart Type is set to Comfort Chart.
Now drag the data point representing the current room temperature on the X (Vertical Line) input field, and the data point representing the humidity on the Y (Horizontal Line) input field.
Under Coordinates, click on Add Coordinate four times to create four empty rows.
For each of the four corners of the comfort area, drag the data point representing the room temperature on the empty slot in the X column, and the data point representing the humidity on the empty slot in the Y column.
If you want to reuse your schematic and have the comfort chart automatically filled with different data points depending on the page from which the schematic was opened (see dynamic links), you can enter a regular expression that matches the data point’s system name. If the system finds a data point in the data point filter from the invoking link shape whose system name matches the regular expression, it will automatically be assigned when the schematic is loaded.
Note that fixed values are not supported in this table. Even if you want to set a specific X or Y coordinate to a fixed value, you still need to create a data point, add a new measurement value to this data point with the desired fixed value, and assign this data point to the respective cell in the grid.
Afterwards, you can open the schematic by configuring a link on the shape of another schematic, select the link type Navigate and the schematic you want to open, and assign a data point filter. If the user clicks on the link shape to open the schematic, the system will automatically assign the appropriate data points that are present in the assigned data point filter and match the system name you entered in the coordinates cell.