View or control mode
When you open a schematic, it initially appears in the view mode. In this mode, you can view the screen or (depending on your authorization) control it, that is, write to individual data points.
You can learn about editing schematics in the section Edit mode.
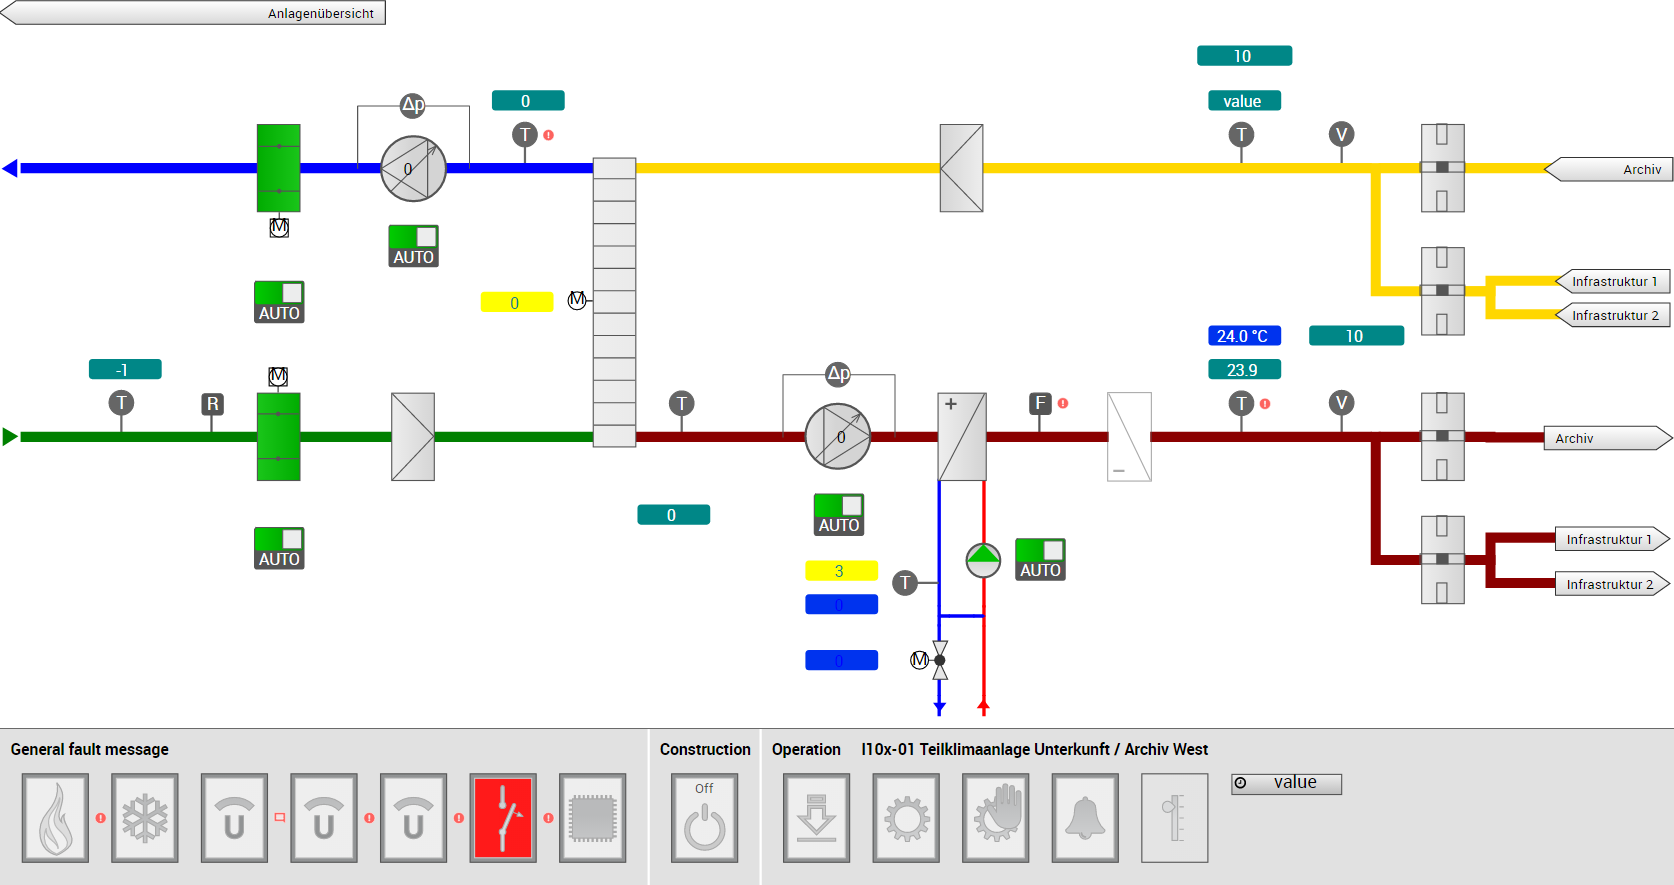
A ventilation schematic
Faceplate: Control the schematic
When you click on a shape in view mode, its faceplate appears. On it, you can view or control the current live values of the underlying data points.
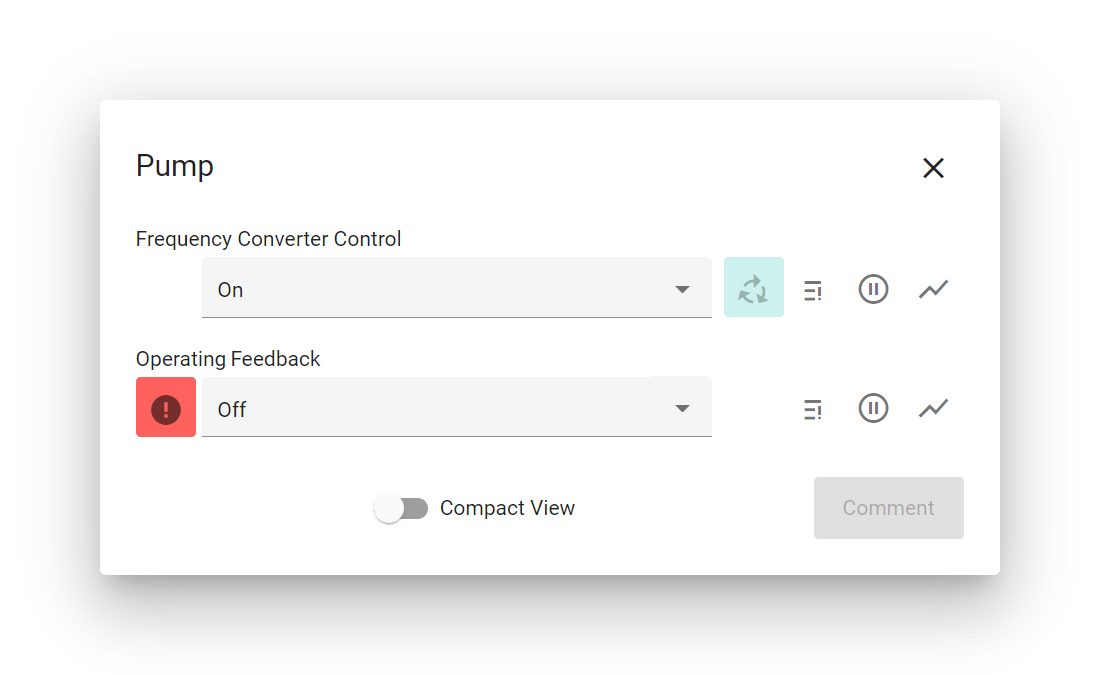
The faceplate of the shape “Pump”
The values of certain properties can be changed and written on the faceplate. The changes are saved immediately. If you made changes and closed the faceplate, you will also be prompted to enter an (optional) comment on the changes made.
Extended view
By default, the faceplate shows a compact view of the assigned data points. Some data points or properties might only be available to privileged users. Users with the action right “Show extended faceplate” can toggle between the compact and extended view by clicking on the toggle button at the bottom center of the faceplate.
To control whether a property should only appear in the extended view, you can set the option “Hide data point property in compact view” on the configuration of the property’s behavior rule in the shape editor.
BACnet write priority
If you’re setting the present value of a BACnet object, it is usually written with the priority of the control system, which is 8 by default, but can be changed on the respective Beetle. However, you can also temporarily override this default priority by clicking on Show Priority Array and selecting a different priority at the top of the Priority array dialog. The selected priority will be used for all subsequent write commands to this BACnet object until the faceplate is closed.
Icons
The following table explains the different symbols on the faceplate.
- Add to chart
Displays the history of measurements of this data point in a temporary chart.
- Alarm status
The data point is currently set to alarm.
- Clear Value
If the present value was written with the priority of the control system (see above), the value can be reset by clicking on Clear Value next to the respective value. This will essentially write a Null with the current priority to the present value of the BACnet object.
The current priority can be temporarily overwritten as described in the section BACnet write priority above.
- Show Priority Array
Displays the priority array with all current values. For more details about this dialog, read the section Priority array below.
- Put out of service
Sets the “Out of Service” flag of the object to True.
- Put into service
Sets the “Out of Service” flag of the object to False.
- Alarm Tickets
Using this menu, all alarms related to the data points placed on this shape can be either acknowledged or resolved.
Warning
Information displayed on the faceplate is always read directly from the device. In contrast, the information used to animate the shape is usually loaded from the local cache. If you notice differences between the representation of a shape and the information on its faceplate, you should synchronize the data point concerned with the Avelon control system again (see Reconcile BACnet objects or Reconcile OPC UA nodes).
Priority array
The dialog Priority array shows the values in the priority array of the present value of the BACnet object and allows you to write or clear specific entries.
Priority
The icon on the left represents the type of the respective priority.
The present value was written automatically by the automation (PLC).
The present value was set via the Avelon control system and overrides the automation.
The present value was set on site or with a priority higher than the control system and overrides the automation.
The present value was set either by a manual emergency switch on site or by the automation to ensure the protection of the system and the safety of the operators.
The present value was set either by a manual emergency switch on site or by the automation to ensure the protection of the system and the safety of the operators. At the same time, the value was also set via the Avelon control system. The former will always take precedence.
Based on the current configuration of the priority array, it is not possible to determine a specific state. It is advised to adapt the configuration of the priority array for that Beetle (see reference above).
Clear value
You can clear the value from the current priority by clicking on Clear Value next to the current value. If you want to clear the value with a different priority, just select the desired priority at the top of the dialog and then click on Clear Value on the respective priority. Keep in mind that all subsequent writes to the same present value will also use this priority until the faceplate is closed.
Write effective value
If you want to write the current present value to the current priority, you can do so by clicking on Write Effective Value. If you want to write the current present value to a different priority, just select the desired priority at the top of the dialog and then click on Write Effective Value on the respective priority. Keep in mind that all subsequent writes to the same present value will also use this priority until the faceplate is closed.
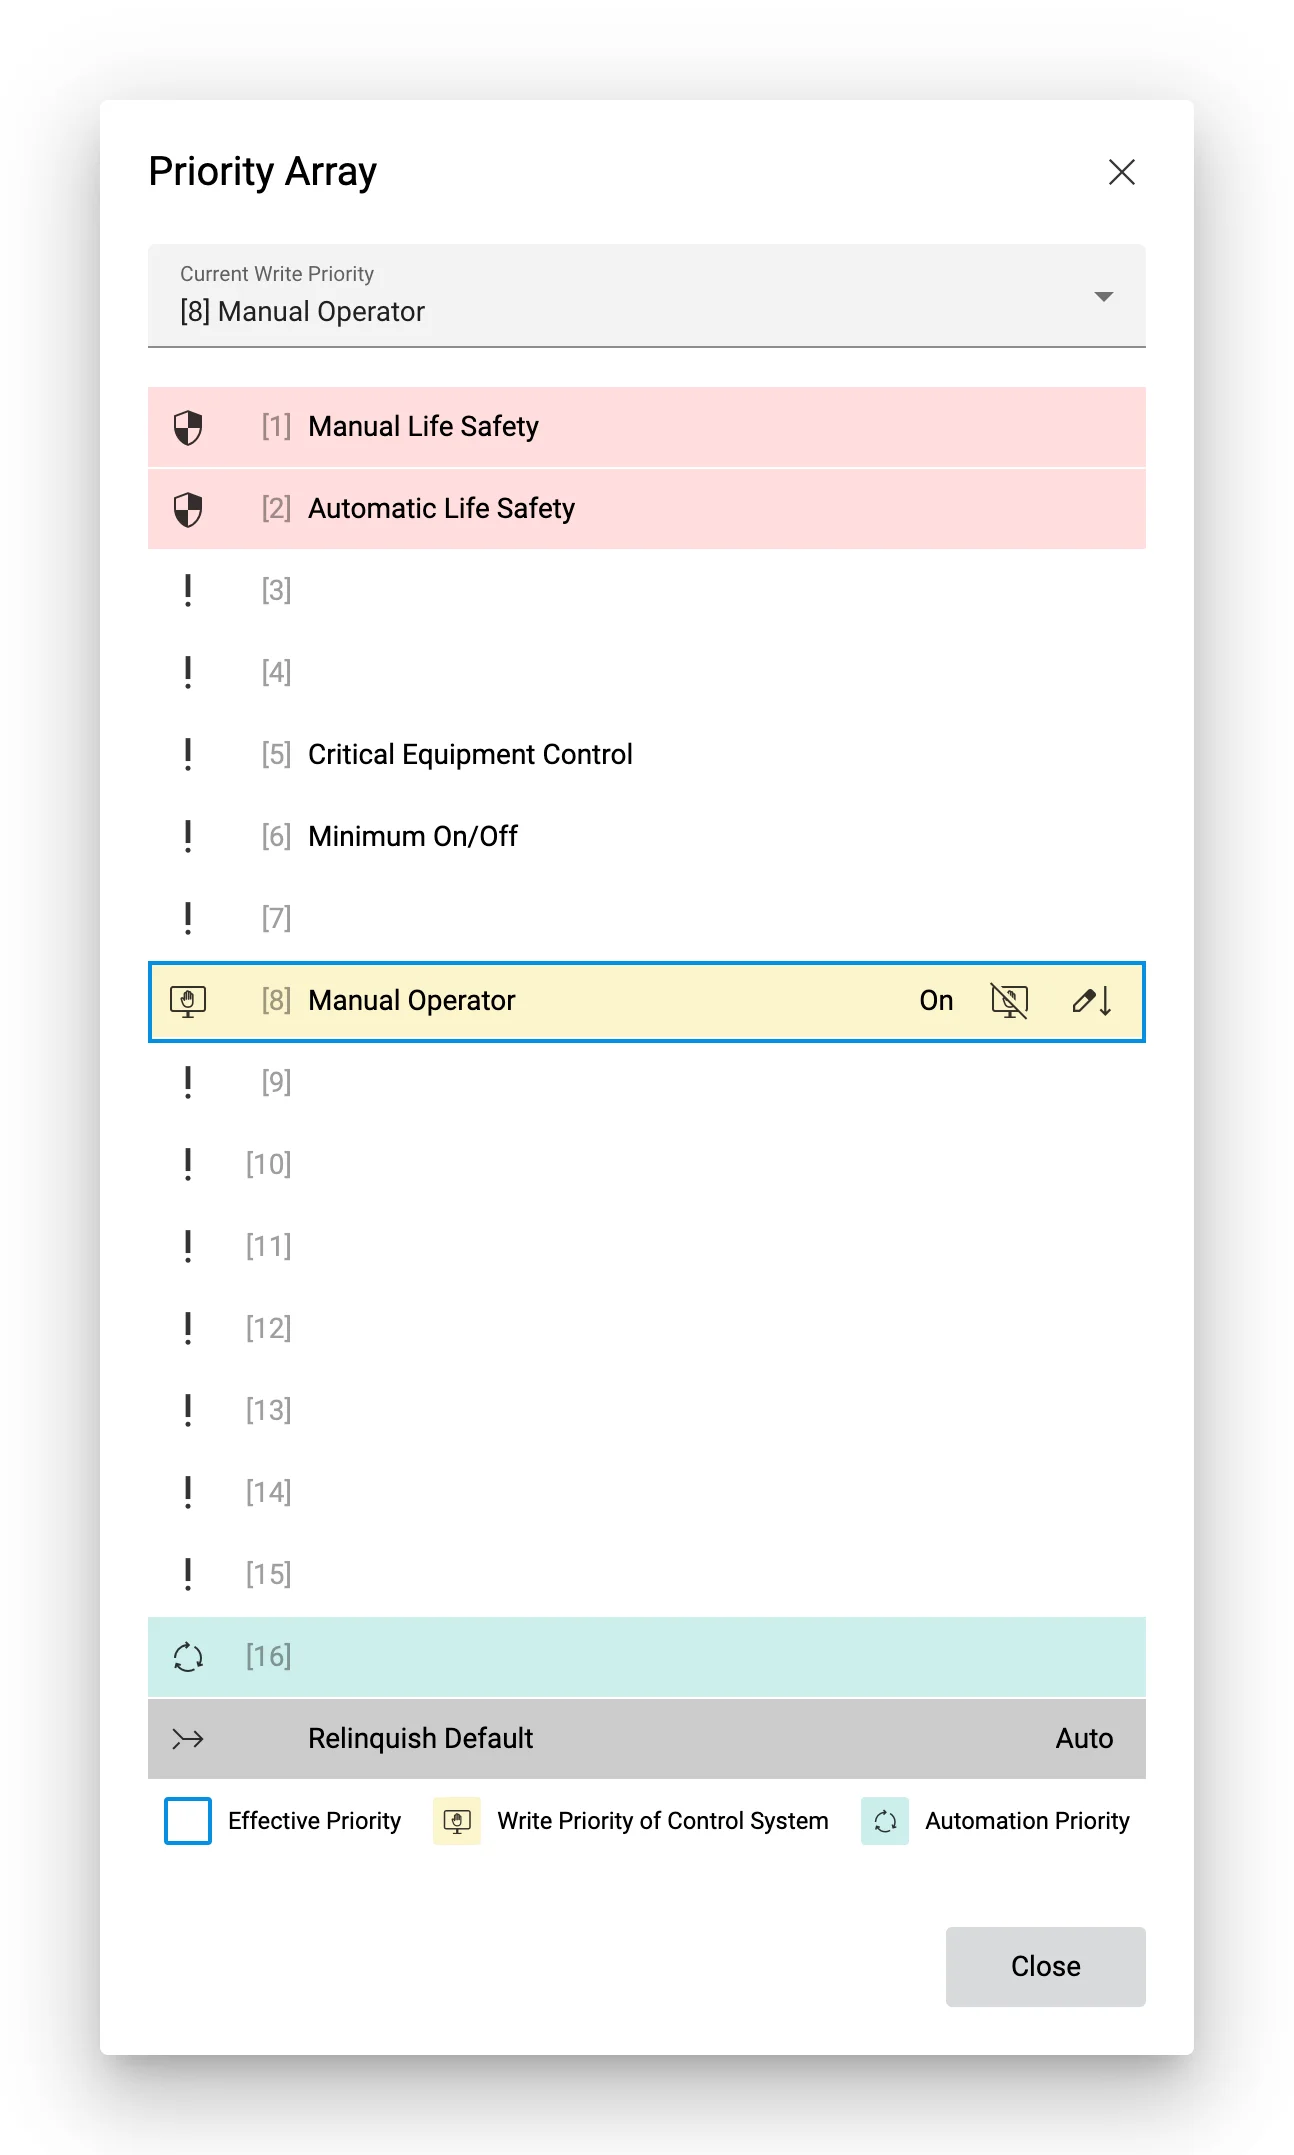
Priority array with the default priority (8).
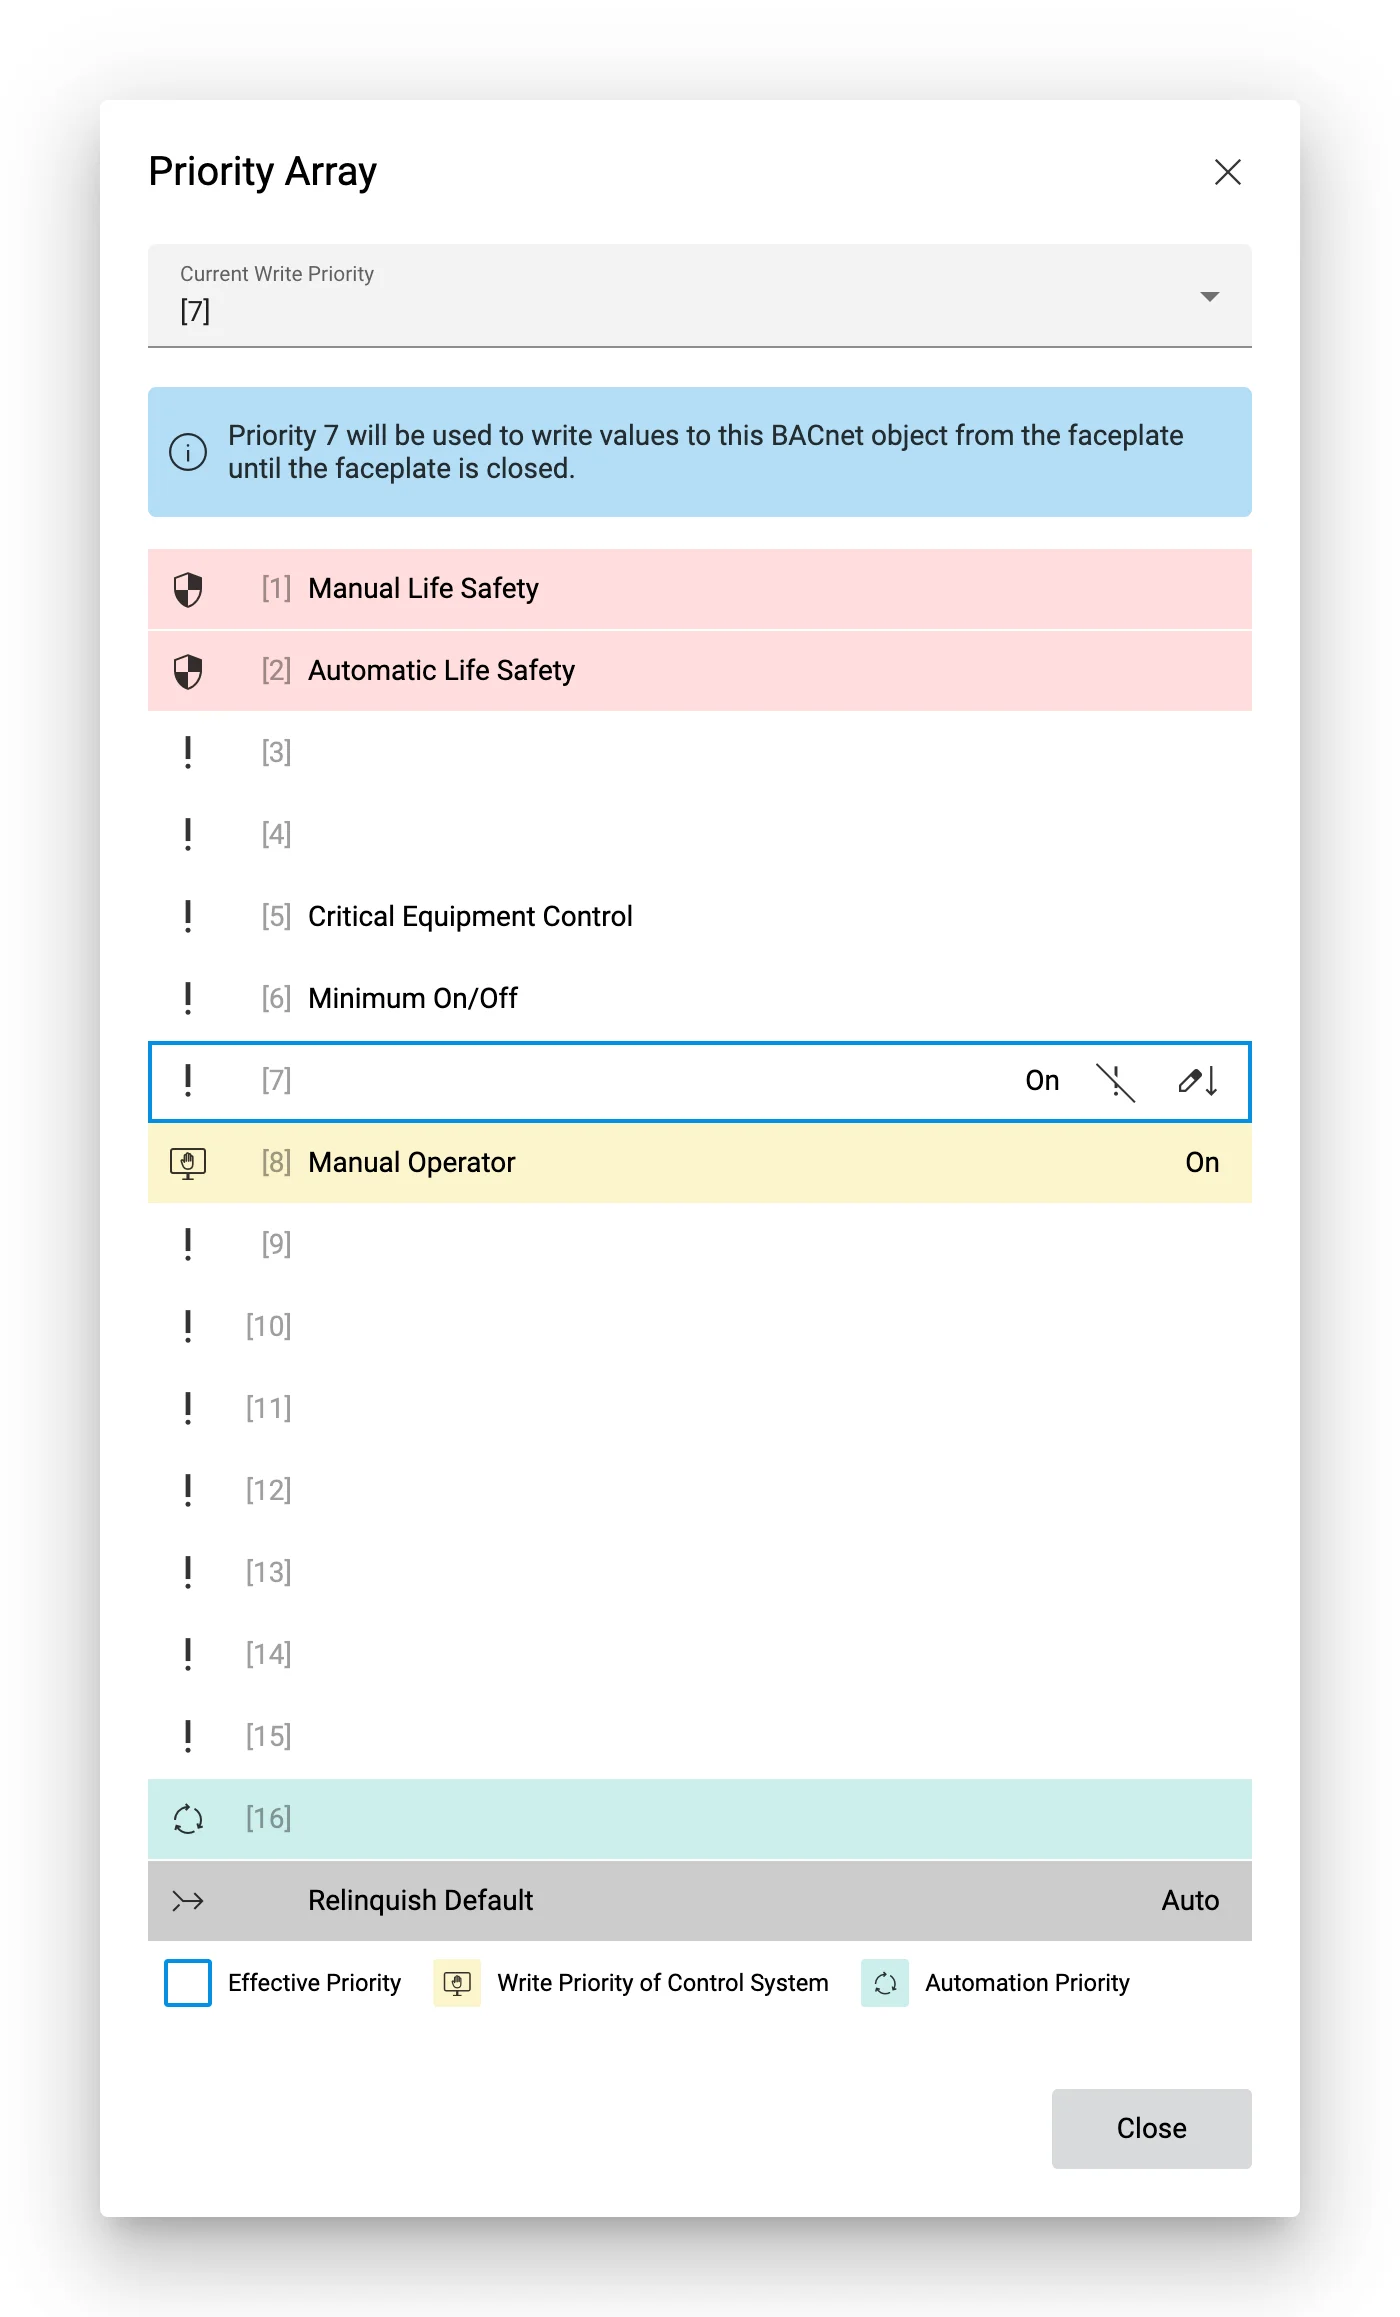
Priority array with the temporary priority 7 selected.
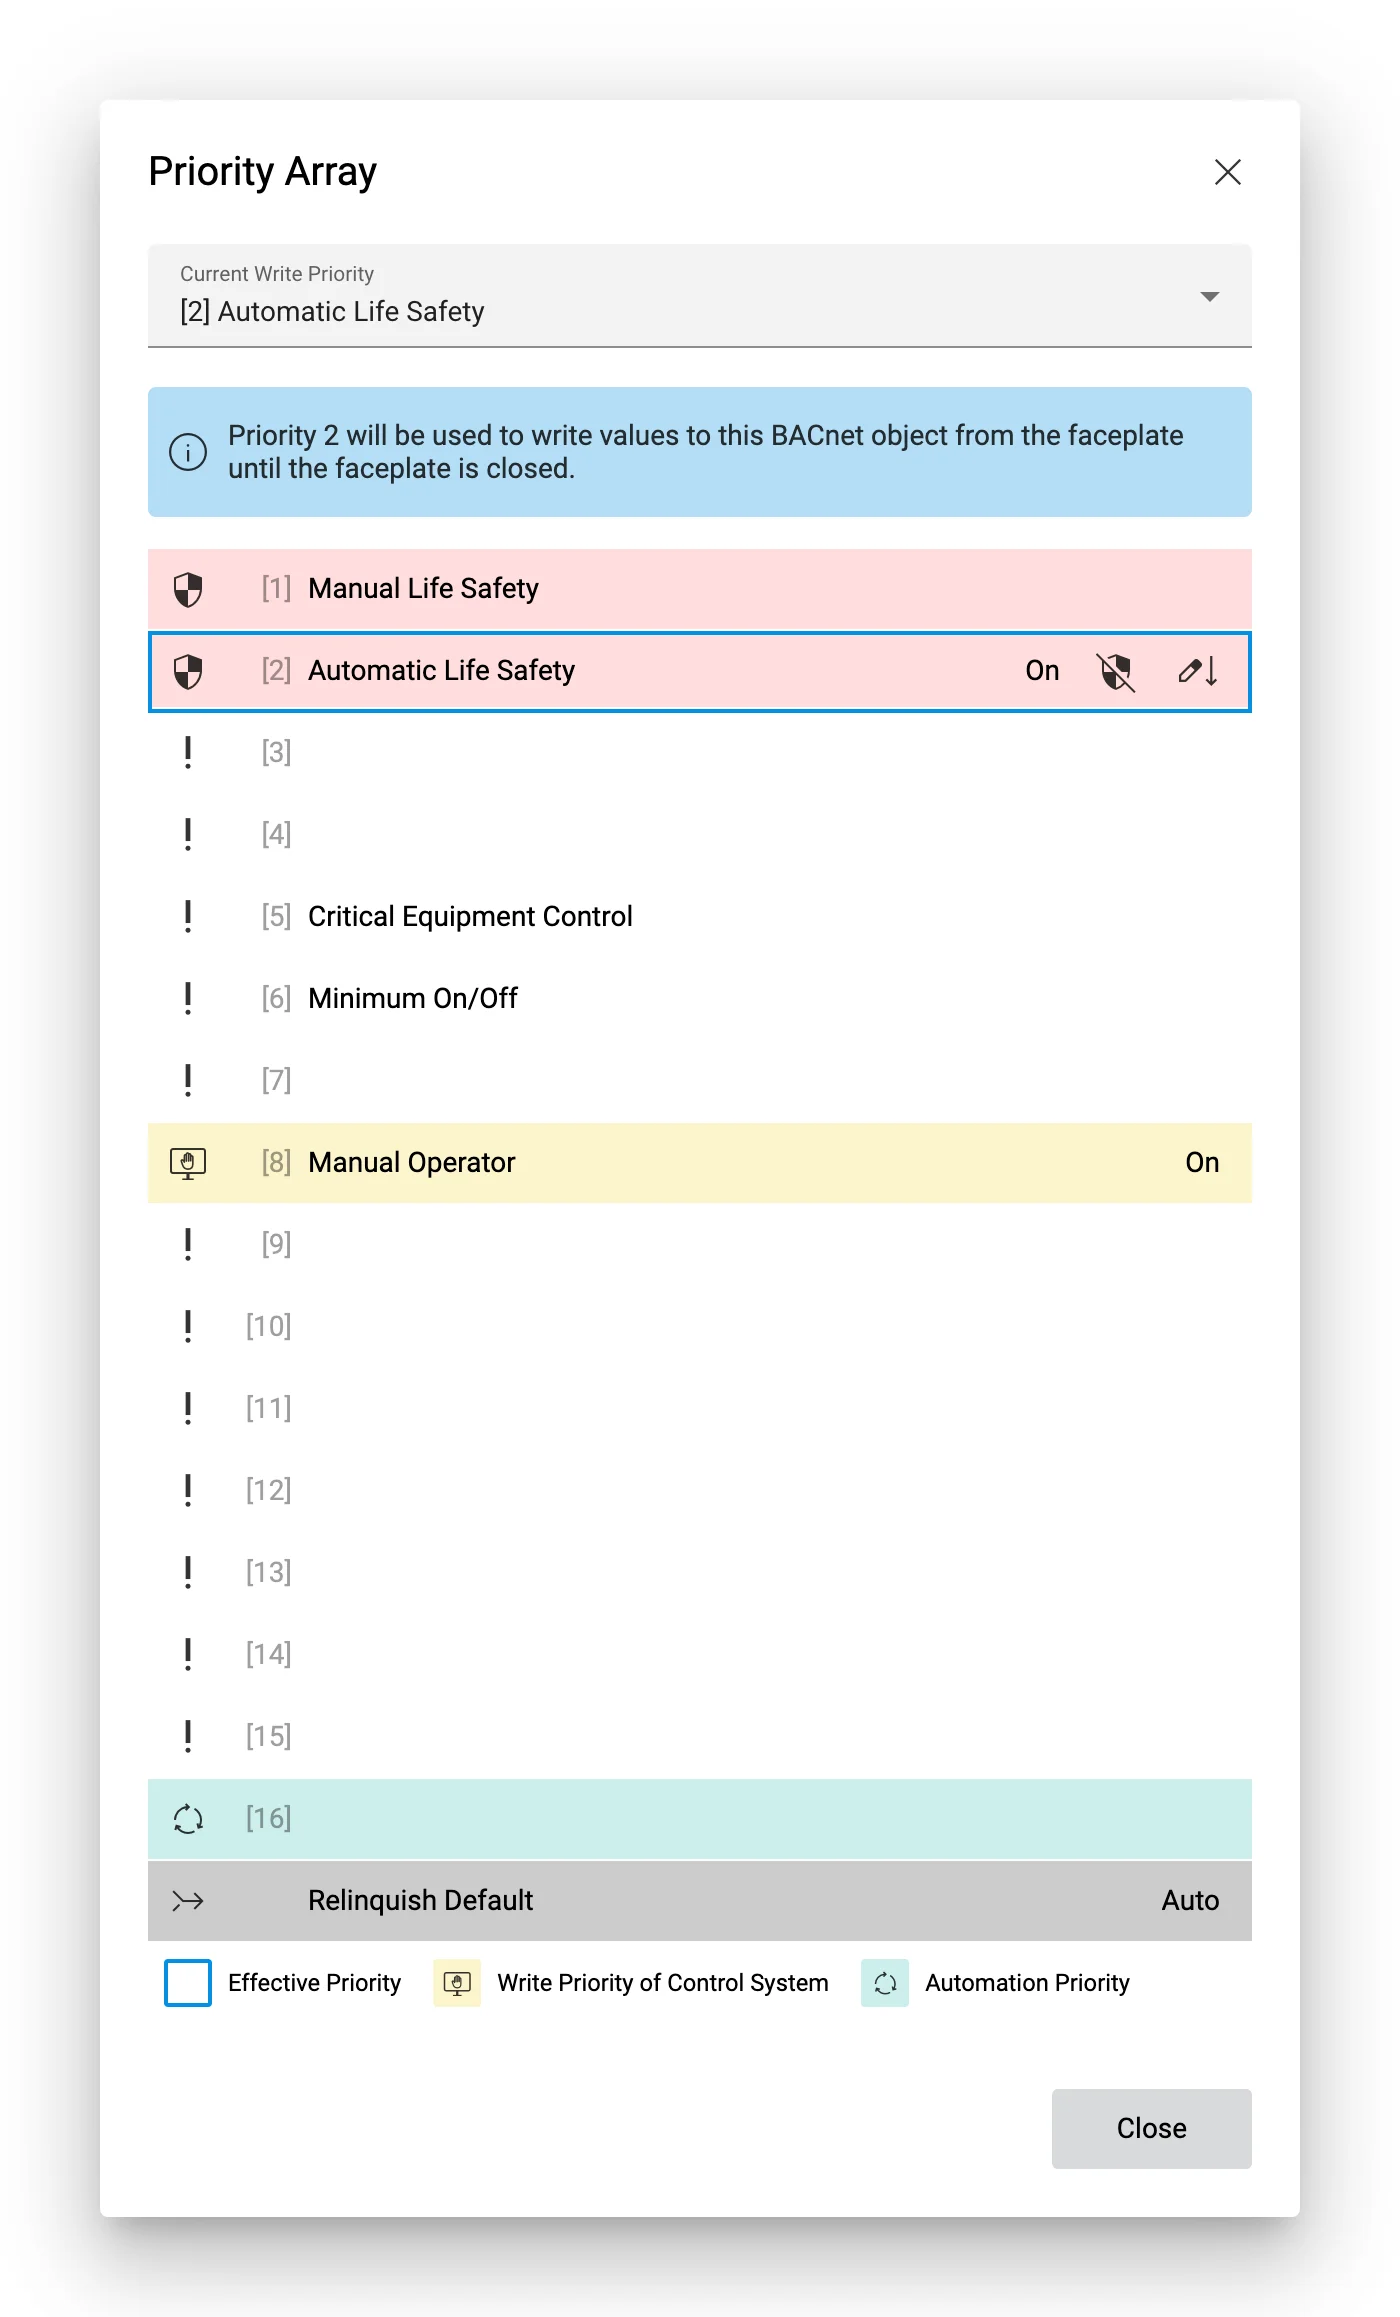
Priority array with the temporary priority 2 selected.
More information on how to configure the priority array can be found in Configure priority array.
Charts
If you click on Add to Chart on the faceplate described above, the measurements of the respective data point are displayed in a temporary chart. You can show or hide this chart at any time using the Chart tab at the bottom of the screen.
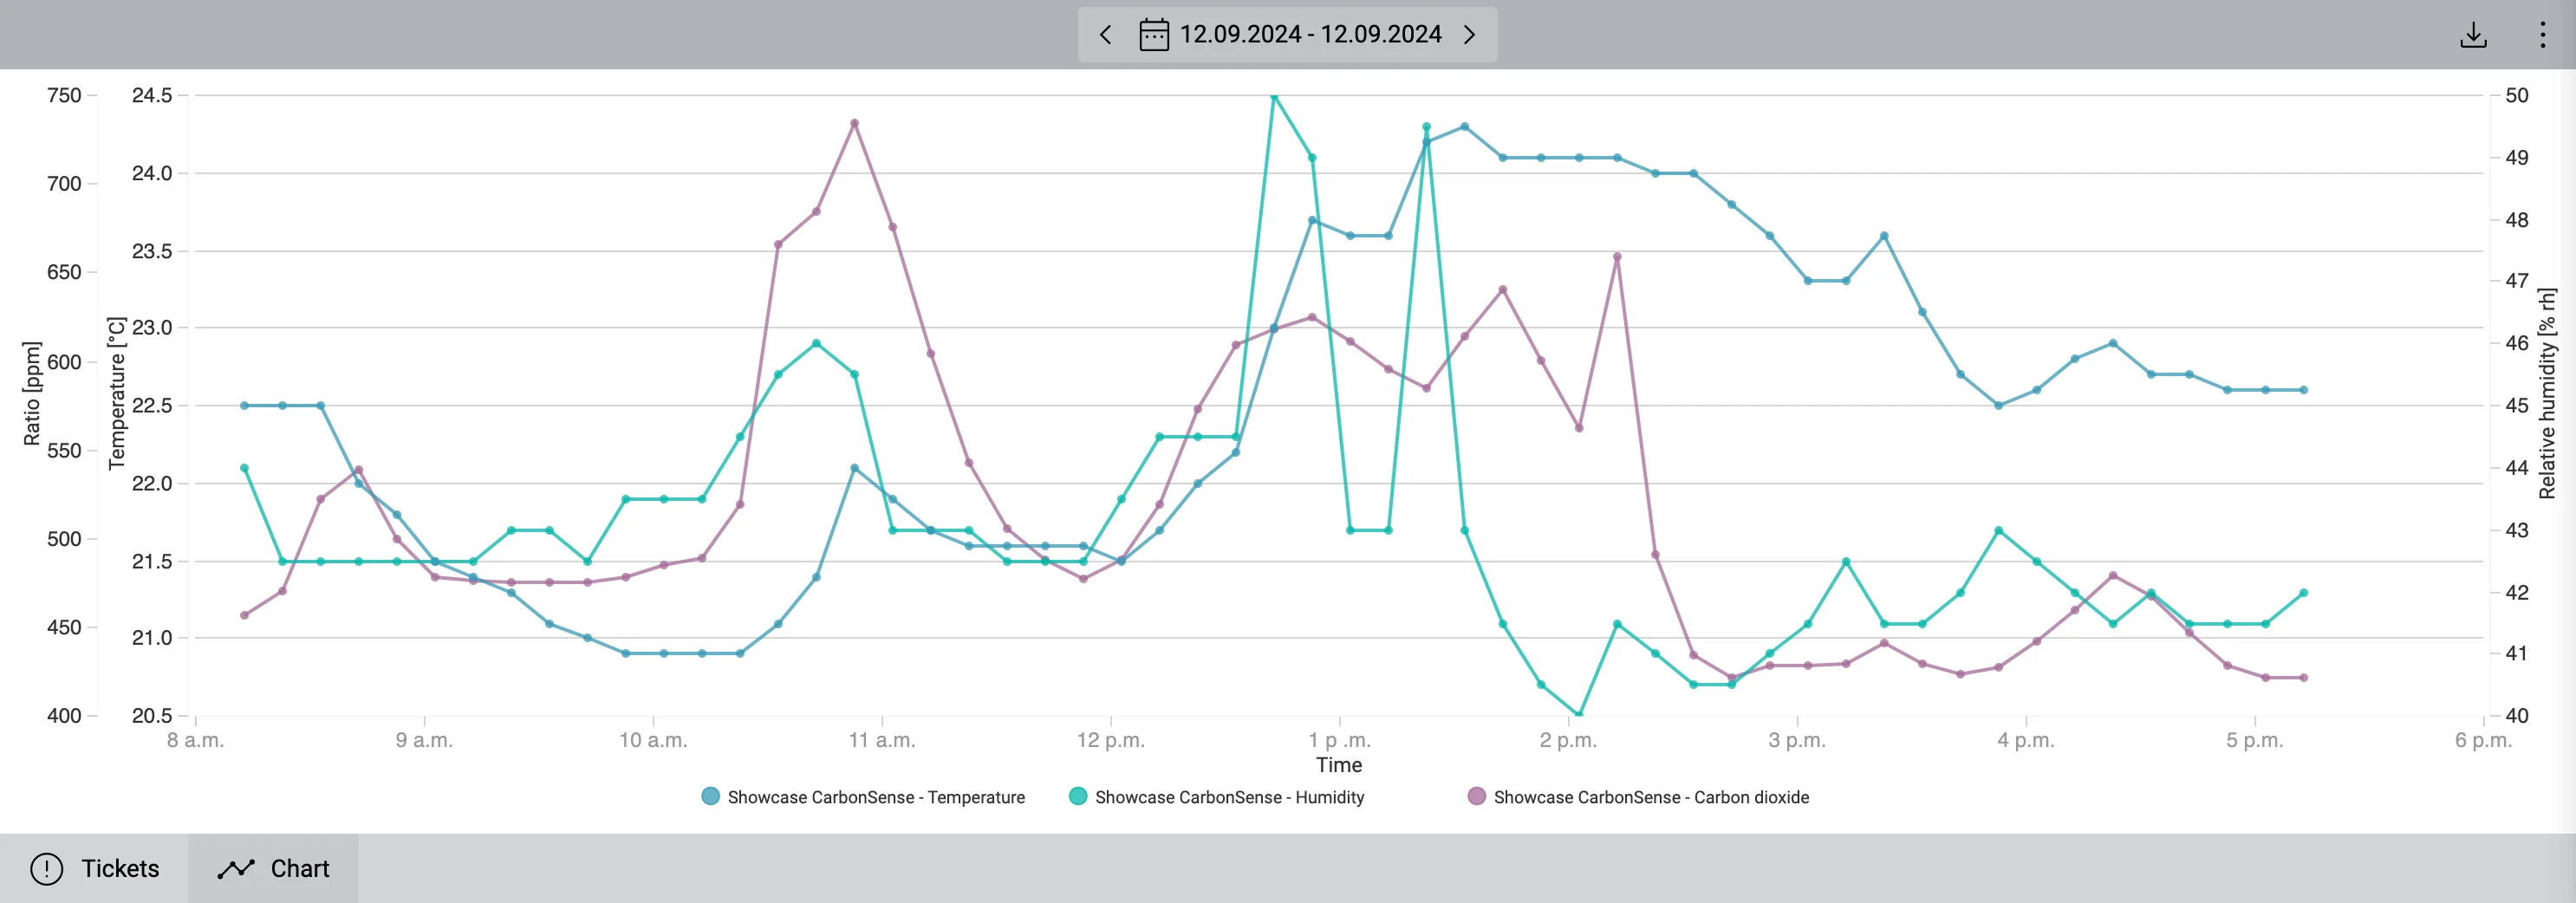
A chart displaying the plots of three different data points.
A maximum of 3000 measurement values can be displayed per data point, and up to 10 different plots can be displayed simultaneously in the chart. If you want to display additional series of measurements, you must first remove an existing one by clicking on More ▸ Remove Plot and then on the plot you want to remove (or on Remove All Plots to remove all plots).
By default, the values are displayed as raw measurement values. If needed, plots can also be displayed as consumption values by clicking on More ▸ Show Values As ▸ Consumption. Note that climate correction won’t be taken into account in this case, though. Climate correction is only applied to the data points in the Media Reporting widget.
You can toggle the legend at the bottom of the chart by clicking on More ▸ Show Legend.
For advanced analysis options, please use the chart widgets. You can convert the plots of the temporary chart into a regular chart widget. This will not only allow you to preserve the chart independently of the schematic, but you will also be able to customize it or use it in reports. To convert the chart, click on More in the top right corner of the chart and click on Convert to Widget. The new chart widget will be placed on the same dashboard as the schematic widget.
The chart can be downloaded in various formats by clicking on the Download button above the chart. Available formats are PNG, SVG, PDF, CSV and Excel.
Tickets
Clicking on the Tickets tab shows a list of all tickets associated with the schematic or the current system. The list behaves similarly to the ticket list widget. The handling of tickets is described in detail in the chapter Ticket list.
Documents
Documents such as data sheets, operating instructions or checklists can be attached to each shape placed on the schematic. These can be displayed and downloaded via the Documents button from the faceplate. The icon will be displayed at the bottom left of the faceplate if there are documents attached to the shape. For more information on how to manage these documents, see section Manage documents.
Jump to shapes that are in alarm
If there are shapes on the schematic that contain data points which are currently in alarm, you can cycle through them by clicking on the alarm state icon at the top right of the page repeatedly.

To zoom back out to the initial view, hold Alt/Option while clicking on the icon.
Keyboard shortcuts
See Keyboard shortcuts.
QR code
You can generate a QR code that you can scan with your mobile device to directly open the current schematic.
To do so, click on More at the top right and then on Download (make sure you’re actually on the fullscreen view of the schematic, not on the dashboard). In the following dialog, either click Download or Print under QR Code to download or print the QR code respectively.
The QR code will be placed on a document measuring 102 × 64 mm, which can be printed on a thermal transfer label for increased durability with a suitable printer (e.g. Zebra), or on regular paper with any printer.