Edit mode
To edit a schematic, i.e. to change shapes and connections, you must first enter the edit mode for the schematic by clicking the Edit icon at the upper right above the schematic.
In edit mode, an orange band appears above the schematic. This band indicates that you can now change the shapes and connections and that any changes made will be saved automatically.
When you switch to edit mode, a number of additional elements are shown to help you while editing the schematic.
Toolbar
The toolbar at the top of the screen allows you to draw simple geometric shapes and to modify existing shapes. How to use dynamic shapes is described in the chapter Working with dynamic shapes.
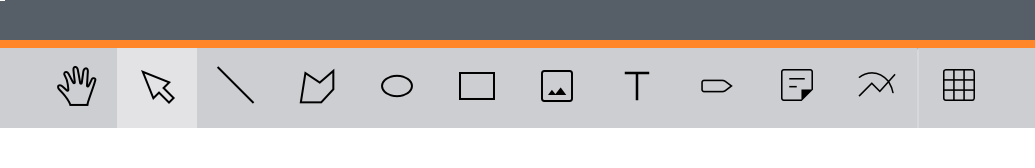
The toolbar is used to place or edit simple drawing elements or to position complex shapes.
- Pan
Move the workspace by dragging it with this tool and zoom with the mouse wheel.
- Select
Select single or multiple shapes and move them.
- Line
Draw lines.
- Polygon
Draw polygons with straight edges.
- Ellipse
Draw ellipses.
- Rectangle
Draw rectangles.
- Image
Place an image.
- Text
Place any text.
- Link
Set a link to another schematic. Principally, each shape can be configured as a link directly from the property sidebar.
- Note
Store a note.
- Chart
Create a Setpoint Curve or Comfort Chart.
- Snap to Grid
Automatically align shapes to a grid when they are dragged.
- Undo
Undo the last local change. See here for more information.
- Redo
Redo the last undone change. See here for more information.
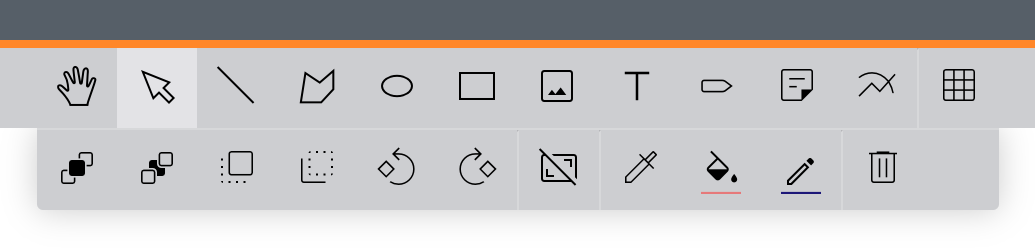
When shapes are selected, additional tools become available in the toolbar.
- Rotate Left 90°
Rotates the selected shapes 90° to the left around their respective centers.
- Rotate Right 90°
Rotates the selected shapes 90° to the right around their respective centers.
- Bring Forward
Moves all selected shapes one layer forward.
- Send Backward
Moves all selected shapes one layer backwards.
- Bring to Front
Moves all selected shapes to the foreground so that they cover all other shapes.
- Send to Back
Moves all selected shapes to the background so that they are covered by all other shapes.
- Reset Transformations
Resets the size of the selected shape to its original size.
- Eyedropper
Set the fill and line color of the selected geometric shape to the colors of another geometric shape.
- Fill Color
Set the fill color of the selected geometric shapes. However, this has no effect on shapes from the shape library.
- Stroke Color
Set the line color of the selected geometric shapes. However, this has no effect on shapes from the shape library.
- 1px Stroke Width
Set the line thickness of the selected geometric shapes. However, this has no effect on shapes from the shape library.
- Delete
Deletes the selected shapes and any connections between them.
Page settings
If you want to edit the size or the general appearance of the page, click on an empty area on the worksheet. The following configuration options are then displayed in the Properties panel on the righ thand side:
- Name
The name of the schematic.
- Adapt page size to contents
If this option is enabled, the size of the worksheet is automatically determined by the outermost shapes. Enlarge the worksheet by simply dragging the shapes further out. If you prefer to work with a fixed worksheet size, disable this option and set the height and width of the worksheet instead.
- Width and height
Set the size of the worksheet in pixels.
- Page Margin
Give the worksheet a margin where no shapes can be placed.
- Master Pages
Select which master pages are to be displayed in the background. You cannot manipulate the shapes on master pages directly, but you can overwrite data points of these shapes locally. The master pages will be layered on top of one another in the order they are assigned. You can change the order by dragging them in the list.
Warning
Information about using master pages: Shapes can only be edited on the page on which they were originally placed.
- Background Style
Select how the background of the schematic is to be displayed on the dashboard.
- Background Color
By default, the background color of the schematic will adapt to the dashboard theme and the selected background style. However, you can select a background color here to manually set the background to a specific color. If a color is selected, Backgound Style will be ignored. If a master page is assigned that has a background color set, its background color will automatically be applied to the current page, too. You can use this mechanism if you want to apply the same specific background color to several of your schematics.
Undo changes and restore old versions
Every change on the schematic is recorded in the change history. You can find the change history in the Details sidebar on the right hand side by going to the History tab. The history includes all changes made by you and other users.
In order to undo local changes, you can click on Undo in the toolbox or press Ctrl/⌘ + Z.
This will undo your previous change.
However, a new version will be added to the change history for every undo action.
Also note that this will only undo changes that have been made locally.
Any changes from other users will not be affected, as long as those are unrelated to your changes.
To restore an old version of a schematic, hover over the version you’d like to restore in the History tab and click on the Restore icon on the right. This will revert all changes from now to the selected version sequentially (including changes from other users) by applying a reverse action for each action in the history. This means that the change history will contain more entries after the reversal than before.
Warning
Entries are retained in the event history for up to 1 year. Older entries will be removed. The history is limited to 1000 entries. If the list exceeds 1000 entries, the oldest entries will be removed as new events are added.
Also note that some operations will cause the change history to be cleared on all affected schematics. This includes editing the shape library as well as generating shapes or placing data points automatically.
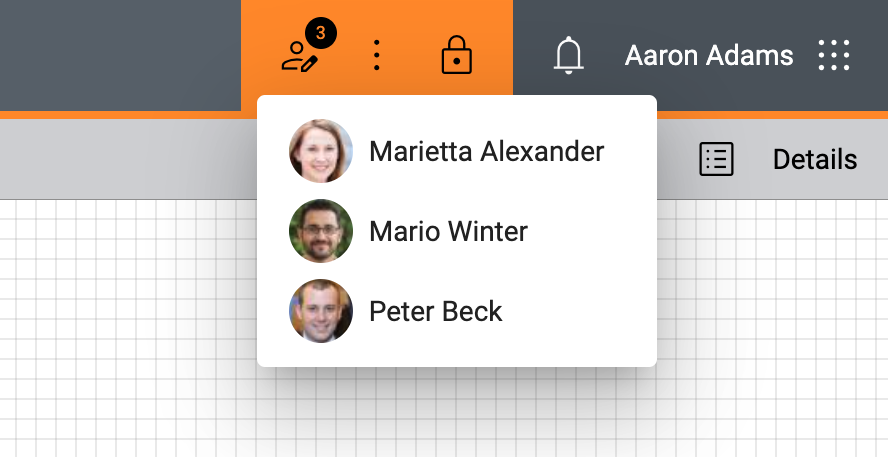
See collaborators
If other users are editing the schematic at the same time as you, the icon will appear in the toolbar at the top. Click on the icon to see a list of all users who are currently editing the schematic.
Working with dynamic shapes
You can create schematics and schematic plans as follows:
Place shapes or data points on the worksheet,
configure the properties of the shapes and
assign data points to change the behavior of shapes.
The following sections explain the individual work steps in detail.
Shape library
To place shapes on the schematic, first open the shape library by clicking on the Library tab at the top left and then on the Shapes tab. All shapes from your shape library are now displayed.
Drag a shape from the shape library onto the schematic to place it.
Place shapes on your schematic by dragging them from the shape library to the worksheet. You can recognize shapes by the following icon:
The shape library is structured hierarchically. You can search for specific shapes by entering the desired search term in the Search field above the shape library.
Note
You can also place data points directly on the schematic. A shape will be automatically added and the data point will be assigned to it. You can determine for yourself exactly which shape should be used for each type of data point (see Configure default shape types).
Shape properties
To edit properties of placed shapes, first select the desired shape on the worksheet by clicking on it and then open the Details panel on the right hand side and select the Properties tab.
The different properties of the shape are grouped thematically. Changes are saved automatically.
Shape
The following properties are typically available for all shapes:
- Label
The name of the shape. For some shapes, this text is displayed within the shape, for others it is only used for identification.
- Rotation
Select the desired rotation. A shape can be rotated about its center in 90° steps.
- Rendered Property
For simple data point shapes (that is, shapes to which only a single data point has been assigned), you can determine which property of the data point is to be displayed in the shape or used to change the shape behavior. However, this only affects those behavior rules for which the value <RenderedProperty> has been configured in the Property column.
- Shape Type
Displays the shape type of the selected shape. For simple data point shapes (i.e. shapes to which only a single data point has been assigned), the shape type can be changed at any time.
- System Name
Part of a system name. This is used to automatically fill shapes with data points by searching for data points with matching system names.
Colors
For simple geometric shapes like Line, Rectangle, Ellipse, Polygon and Text shapes, you can also define a fill and stroke color and a stroke width.
By default, the selected colors will be displayed in both light and dark mode. In some cases, however, you may want the color to be automatically adjusted in dark mode to better match the darker color scheme, for example if you use big colored rectangles as backgrounds for your schematics.
To do this, simply set the option Adapt Brightness Automatically to In Dark Mode if you’re currently working in light mode (or to In Light Mode if you’re currently working in dark mode), and the brightness of both the fill and stroke color will be adjusted automatically in that mode.
Specifically, dark colors will be made lighter and light colors will be made darker. The more vibrant or transparent the selected color is, the less it will be affected by the automatic adjustment.

A shape with a fully opaque fill color in light mode. |

Without automatic brightness adjustment: The fill color looks the same in dark mode. |

With automatic brightness adjustment: The colors are automatically adjusted to the respective mode. |
An alternative to this setting is to increase the transparency value of the selected color. That way, the color of the shape will automatically adapt to the respective mode because the background color of the schematic will still shine through and affect the overall brightness of the shape.

A shape with a transparent yellow fill color in light mode. |

The same shape in dark mode without any further adjustments. |
Data point
If exactly one data point has been assigned to a shape, its properties are also displayed.
- Bus Address
The internal address of the bus object. The format depends on the respective bus type.
- Data Point Type
The type of the data point.
- Decimals
The number of decimal places with which live values are displayed on the schematic or in other widgets.
- GUID
The global, unique identifier of the data point.
- Label
The description of the data point in human readable form.
- Physical Quantity
The physical measured variable.
- System Name
The systematic name of the data point, for example the object code based on the plant identification system (AKS).
- Display Unit
The unit in which the data point is displayed on the schematic or on other widgets.
- Default Unit
The unit in which the device delivers the measurement values.
Link
A shape can also be used to navigate between different schematics or to external web pages when the user clicks on them.
See Links for more information on how to set up links on shapes and the different options for link types and targets.
Assigned data points
The appearance and behavior of shapes can be changed by assigning data points to them. To assign data points, open the Data Point Assignment tab at the bottom and drag data points from the data point sidebar to the desired behavior rule.
The behavior rule is then automatically applied as soon as live values of the data point are received and match the condition of the behavior.
Remove incorrectly placed data points simply by clicking Remove Data Point.
The available behavior rules or data point slots can be edited in the shape editor (see Shape behavior).
In the Data Point Assignment sidebar at the bottom of the screen, you can assign data points to your shapes, which are then used in the visualization and behavior of the shape.
Note
If the selected shape comes from a master page, you can overwrite any possible data point placements of the master page by simply dragging another data point onto an existing placement. You can restore the placement of the master page by removing the overwritten data point by clicking Remove Data Point.
Generate shapes
The option More ▸ Generate Shapes allows for automatic placement of shapes. This is especially helpful while setting up a new schematic.
Prerequisites: To use the feature, all involved shapes must have a system name set in their shape configurations (see System name in behavior rules), so that the system can match data points to them.
You will be asked to provide the system name prefix of your plant identifications, and the system will search for all data points that match this prefix. All shapes whose system names match a system name of any of these data points will be placed on the schematic, and the data points are then automatically assigned to these new shapes, if possible.
Click on Next to see a preview of all new shapes and their placed data points. You can go back and fix the system name prefix if the preview is not correct, or click Apply to generate the shapes.
Example
Assume you have a number of offices (A - C), and 1 or 2 climate sensors per room, marked as 001 and 002, respectively. The system names of these data points might look as follows:
Office A:
OfficeA_Sensor001_Temp,OfficeA_Sensor001_Hum,OfficeA_Sensor002_TempandOfficeA_Sensor002_HumOffice B:
OfficeB_Sensor001_Temp,OfficeB_Sensor001_Hum,OfficeB_Sensor002_TempandOfficeB_Sensor002_HumOffice C:
OfficeC_Sensor001_Temp,OfficeC_Sensor001_Hum
If you want to generate shapes that are automatically filled with the correct sensor data points depending on the office in which they’re located, you can set Sensor%L_Temp and Sensor%L_Hum as the system name in the definition of your shape.
%L acts as a placeholder for any alphanumeric sequential number (e.g. A, B, C… or 0, 1, 2…).
In our example, Sensor%L_Temp matches the temperature data point, while Sensor%L_Hum matches the humidity data point in any of the sensors.
You can now click on More ▸ Generate Shapes.
In our example, we enter the text OfficeA_ in the wizard.
Based on our example shape and the data points listed above, we expect to see two new shapes on our schematic for office A, one for sensor 1 and one for sensor 2, each with two data points (temperature and humidity, respectively).
Place data points automatically
Instead of selecting shapes individually and assigning data points manually to each of them, go to More to select the option Place Data Points Automatically. This option can be especially useful when shapes are already added to your schematic and you need to add data points to the shapes.
Prerequisites: To use the feature, all involved shapes must have a system name set in their shape configurations (see System name in behavior rules), and the System Name property on every placed shape on the schematic must be set so that ambiguous assignments are prevented if there are multiple matching data points.
In the field System Name Prefix, enter the first part of the system name that denotes the room or location of the installation depicted on the schematic, and all the matching data points will automatically be assigned to your already placed shapes.
The input also accepts * and ?, which will match a single arbitrary character (?) or multiple arbitrary characters (*), respectively.
To find appropriate data points, the system takes the system name prefix from the dialog, the system name defined on each shape instance and the system name expression on the shape configuration into consideration.
Only data points that satisfy all three patterns will be assigned.
- Scope
Define which shapes should be included:
Group: All shapes on all schematics of the current group.
Page: All shapes on the current schematic (default).
Selected: Only the selected shapes on the current schematic.
- Preserve existing assignments
Existing data point assignments will not be changed or removed. Only new data point assignments will be added.
- Remove existing assignments if they don’t match
Existing data point assignments will be removed if no matching data point can be found for that slot on the shape. This option is ignored when Preserve existing assignments is selected.
Click on Next to see a preview of all the data point assignment changes. You can go back and fix the settings if the preview is not correct, or click Apply to apply the data point assignments.
Replace data points
This option allows you to easily replace already assigned data points on a schematic with others, for example if the schematic is a copy of another schematic and all data points need to be substituted. You can also specify whether existing data point placements that don’t match the system you searched for should be deleted or simply ignored. To use this option, go to More in edit mode and click on Replace Data Points.
Check data point assignments
The system offers an automatic check to determine whether all shapes have been equipped with the necessary data points. This eliminates the need to manually check each individual shape to verify the completeness of the data point assignments.
On the corresponding schematic, click on More at the top right and then on Check Data Point Assignments. The system then generates an Excel workbook with different pages which breaks down all the behavior rules and the data points placed in them.
. |
Correct Data Point Placements |
Lists all data points that have been placed in shapes and whose system name (AKS code) matches the default from the shape. |
. |
Unused Data Points |
Lists all data points that have been assigned to the current group by a data point filter but have not been placed on the schematic. |
. |
Required Placements |
Lists all data point placements that the shape specifies as being required. You can change this specification by editing the affected shape in the shape editor and activating or deactivating the option Data point required to pass the quality check in the corresponding shape behavior. |
. |
Wrongly Placed Data Points |
Lists all placed data points whose system name does not match the default from the shape. |
. |
Unused Data Points |
Lists all data points that have been assigned to the current group by a data point filter but have not been placed on the schematic. |
. |
Summary |
A compilation of all other worksheets. Each row is marked with the color of the corresponding worksheet. |
Note
All schematics of the current group and all subgroups are included in the check of the data point placements. This allows the data point placements of an entire system or subsystem to be checked all at once.
Restrict access to shapes
By default, all users that have access to a schematic are also allowed to control them. However, you can restrict access rights to certain shapes and allow only specific users to manipulate data points via the schematic.
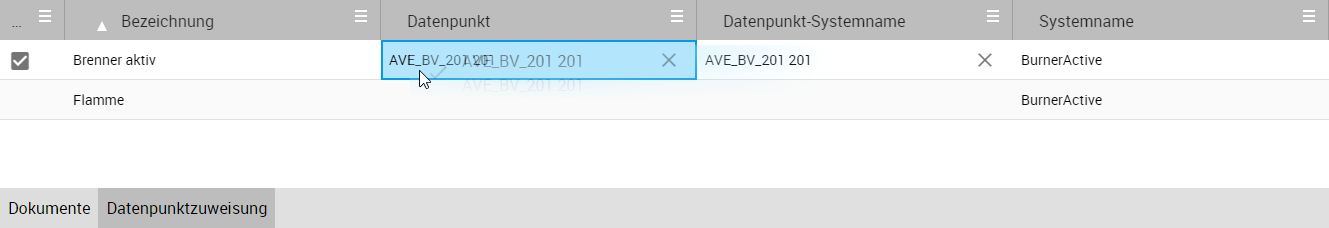
To do so, click on More in the toolbar at the top and then on List to switch to the list view. All shapes that are placed on the schematic are listed here, along with the data points they contain.
Select on or several rows whose access rights you want to restrict, and then click on the icon Restrict Write Access with User Groups at the top right. In the following dialog you can assign the user groups that are allowed to write on the selected data point properties. The assigned user groups will also appear in the column User Groups.
Data point bar
You can place frequently used or common data points in the toolbar located below the schematic. These will always be displayed below the schematic, even if you zoom or pan.

Place data points in the bottom toolbar to keep an eye on general measurements.
Switch to edit mode by clicking Edit at the top right.
Drag any data point from the data point sidebar to the toolbar at the bottom of the screen to attach it. For each data point, a symbol for the medium type and the current measurement value will be displayed.
You can change the order of the data points by dragging them within the toolbar. To remove a data point from the toolbar, click on Remove next to the respective data point.
Configure default shape types
If you drag a data point directly onto the schematic, a data point shape is created automatically. You can specify for each data point type separately which shape type should be used for it.
Open the data point sidebar by first clicking on the Library button at the top left and then on the Data Points tab.
On the data point tab, click on Configure Default Shape Types.
In the following dialog, select the desired data point type at the top left. If necessary, change the protocol first.
On the right-hand side, you can now select which shape type should be used when you drag a data point of the corresponding type onto the schematic in the future.
Confirm the configuration with Save.
Note
Note that these settings are saved per user. Each user can define for themselves which shapes they want to use when placing data points. Changes have no effect on the default shape types of other users.
Changes to the default shape type assignments have no effect on already placed shapes.
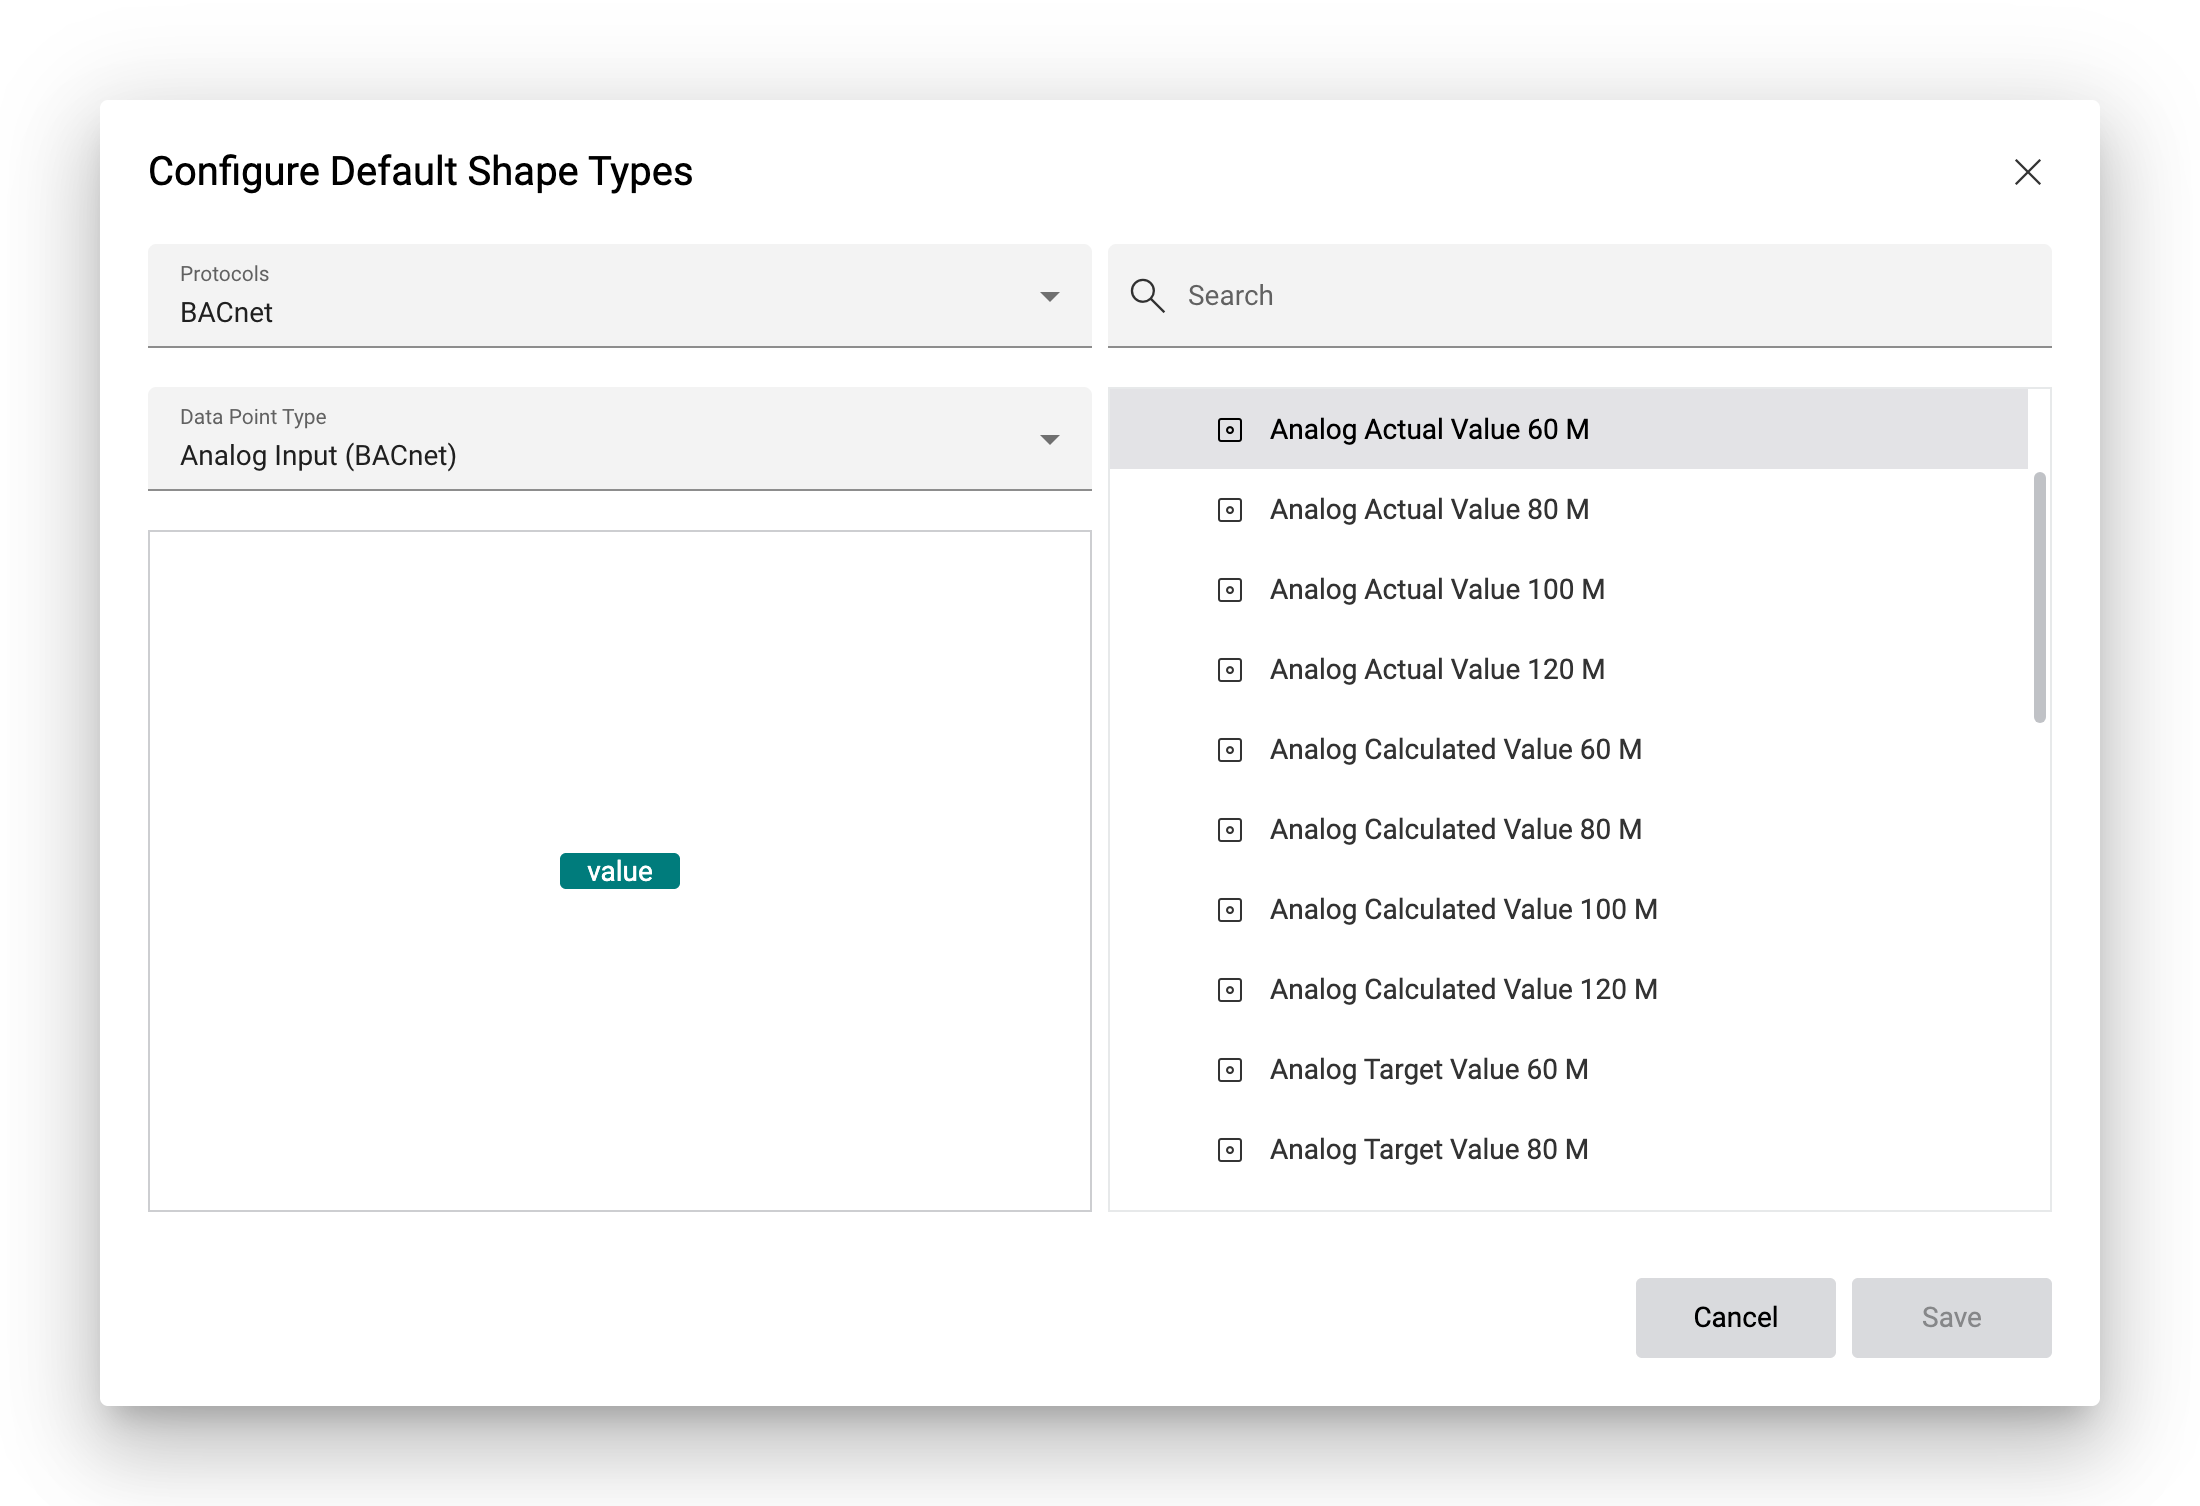
This dialog is used to assign data point types to shape types.
Schedules and calendar objects
If you drag a BACnet schedule or BACnet calendar data point on the schematic, a visual representation of the schedule is displayed when the user clicks on the shape in view mode.
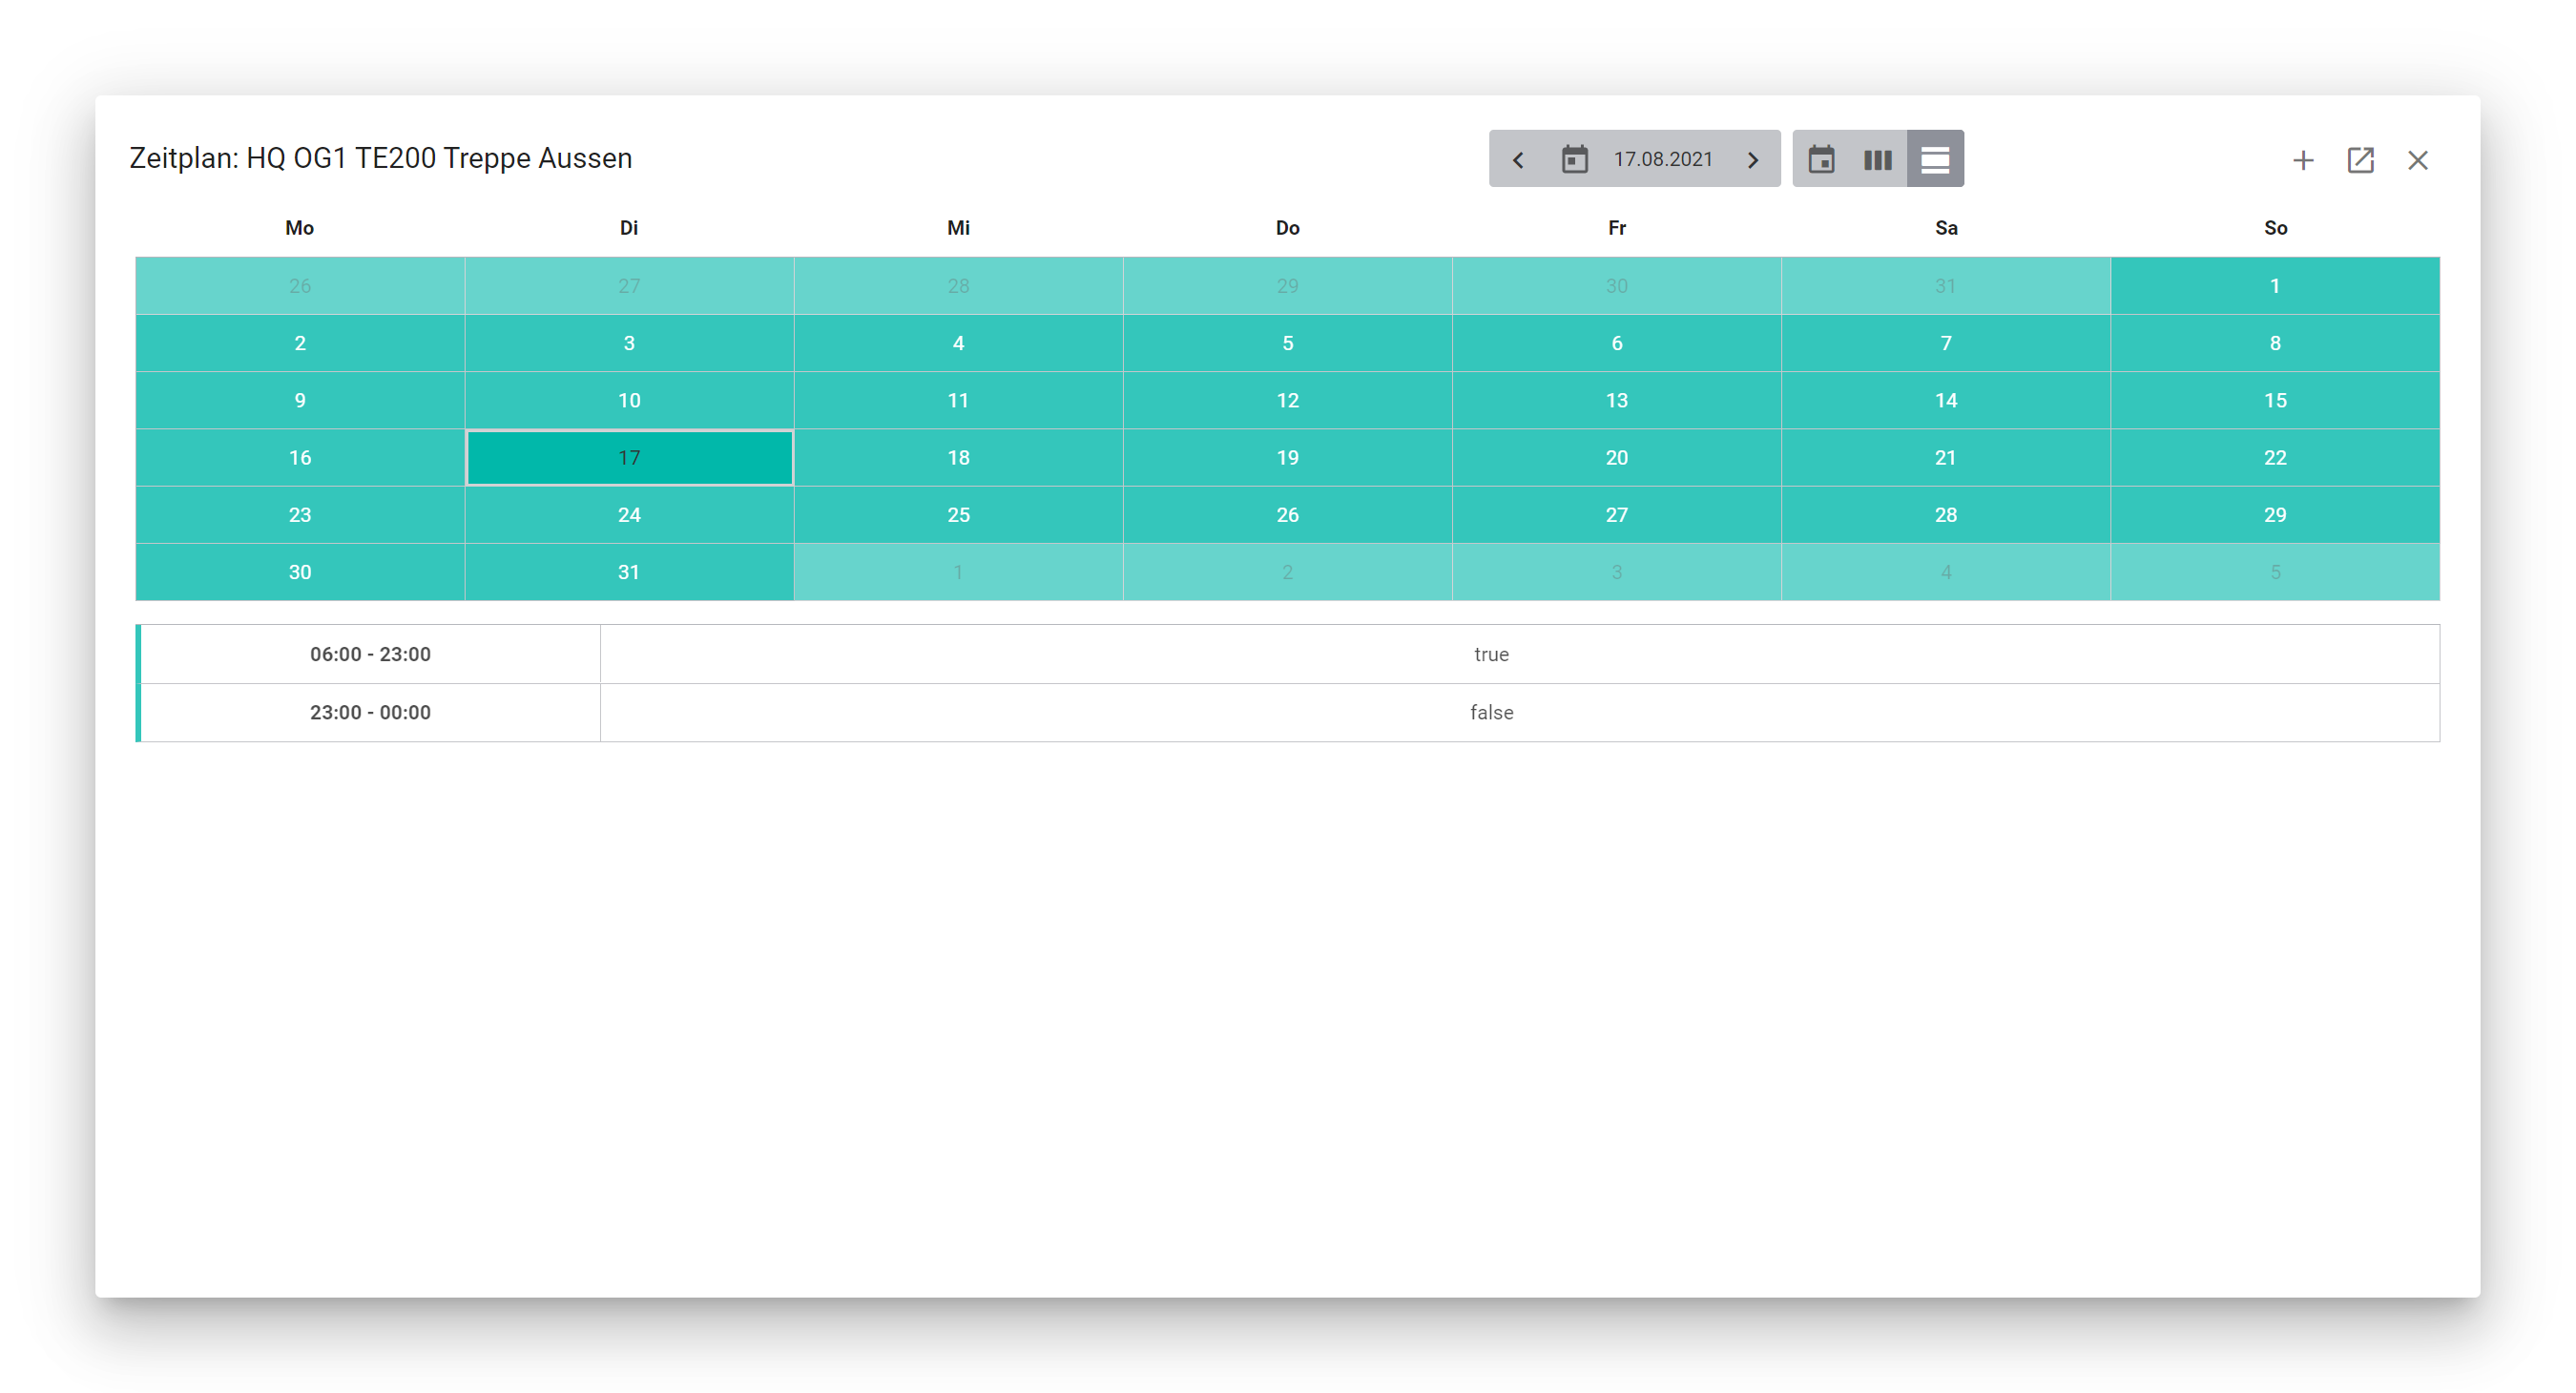
If you have the appropriate rights, you can add new items to the schedule with Add, edit or delete existing items, or navigate to the details of the data point by clicking on Go to Data Point at the top right.
Manage documents
For each shape placed on the schematic, documents can be assigned that can then be downloaded via the faceplate that appears when the shape is clicked.
To manage the documents, select the appropriate shape, open the Details sidebar on the left and go to the Properties tab, and scroll down to the section Documents. You can add documents from document management or remove documents that have already been attached. For general information on managing documents, see Manage documents.
Keyboard shortcuts
See Keyboard shortcuts.