Bézier curves
You can define quadratic and cubic Bézier curves in the <path> element.
To do so, you must define one or two control points which determine the direction and slope of the curve in addition to the start and end points.
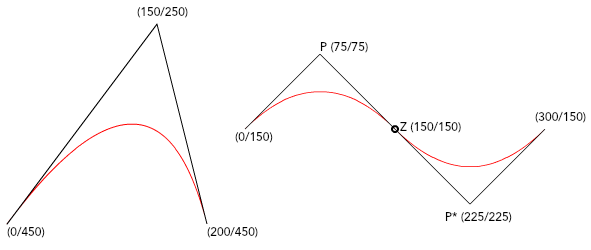
Quadratic Bézier Curve
<path d="M 0,450 Q 150, 250 200,450" stroke="red" />
<path d="M 0,450 q 150,-200 200,0" stroke="red" />
First, define the starting point after the M (“move to”) command.
Use Q/q to specify that a quadratic Bézier curve is to be drawn.
Using upper or lower case letters for the command allows you to specify whether you want to use absolute (Q) or relative (q) values for the points.
Smooth Quadratic Curve
You can use the T/t command to generate a smooth transition between two curves.
In this case you only have to specify the end point of the second curve.
The control point is automatically generated by point reflection.
The end point of the first curve acts as a fixed point from which the first control point is mirrored and through which the new control point is created.
<path d="M 0,150 q 75,-75 150,0 t 150,0" stroke="red" />
<path d="M 0,150 Q 75,75 150,150 T 300,150" stroke="red" />
Cubic Bézier Curve
In the cubic Bézier curve you specify two control points.
The command for this type of curve is C/c (“curve to”).
<path d="M 0,100 C 0,0 150,0 150,100" stroke="green" />
<path d="M 0,100 c 0,-100 150,-100 150,0" stroke="green" />
After the start point, you define both control points and the end point.
If you use the capital letter C, you must specify the absolute values of the points.
If you want to use the relative values, use the lower case letter c.
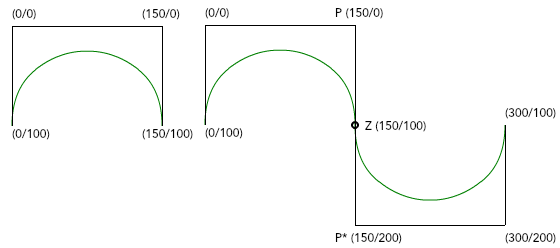
Shorthand / Smooth Curve To
You can use S/s for a smooth, seamless transition between two curves.
As with the quadratic curve, the second control point of the first curve is reflected on the end point and thus generates the first control point of the second curve.
Consequently, after the command S/s you still have to specify the absolute or relative values of the second control point and the end point of the second curve.
<path d="M 0,100 C 0,0 150,0 150,100 S 300,200 300,100" stroke="green" />
<path d="M 0,100 c 0,-100 150,-100 150,0 s 150,100 150,0" stroke="green" />