Ticket overview
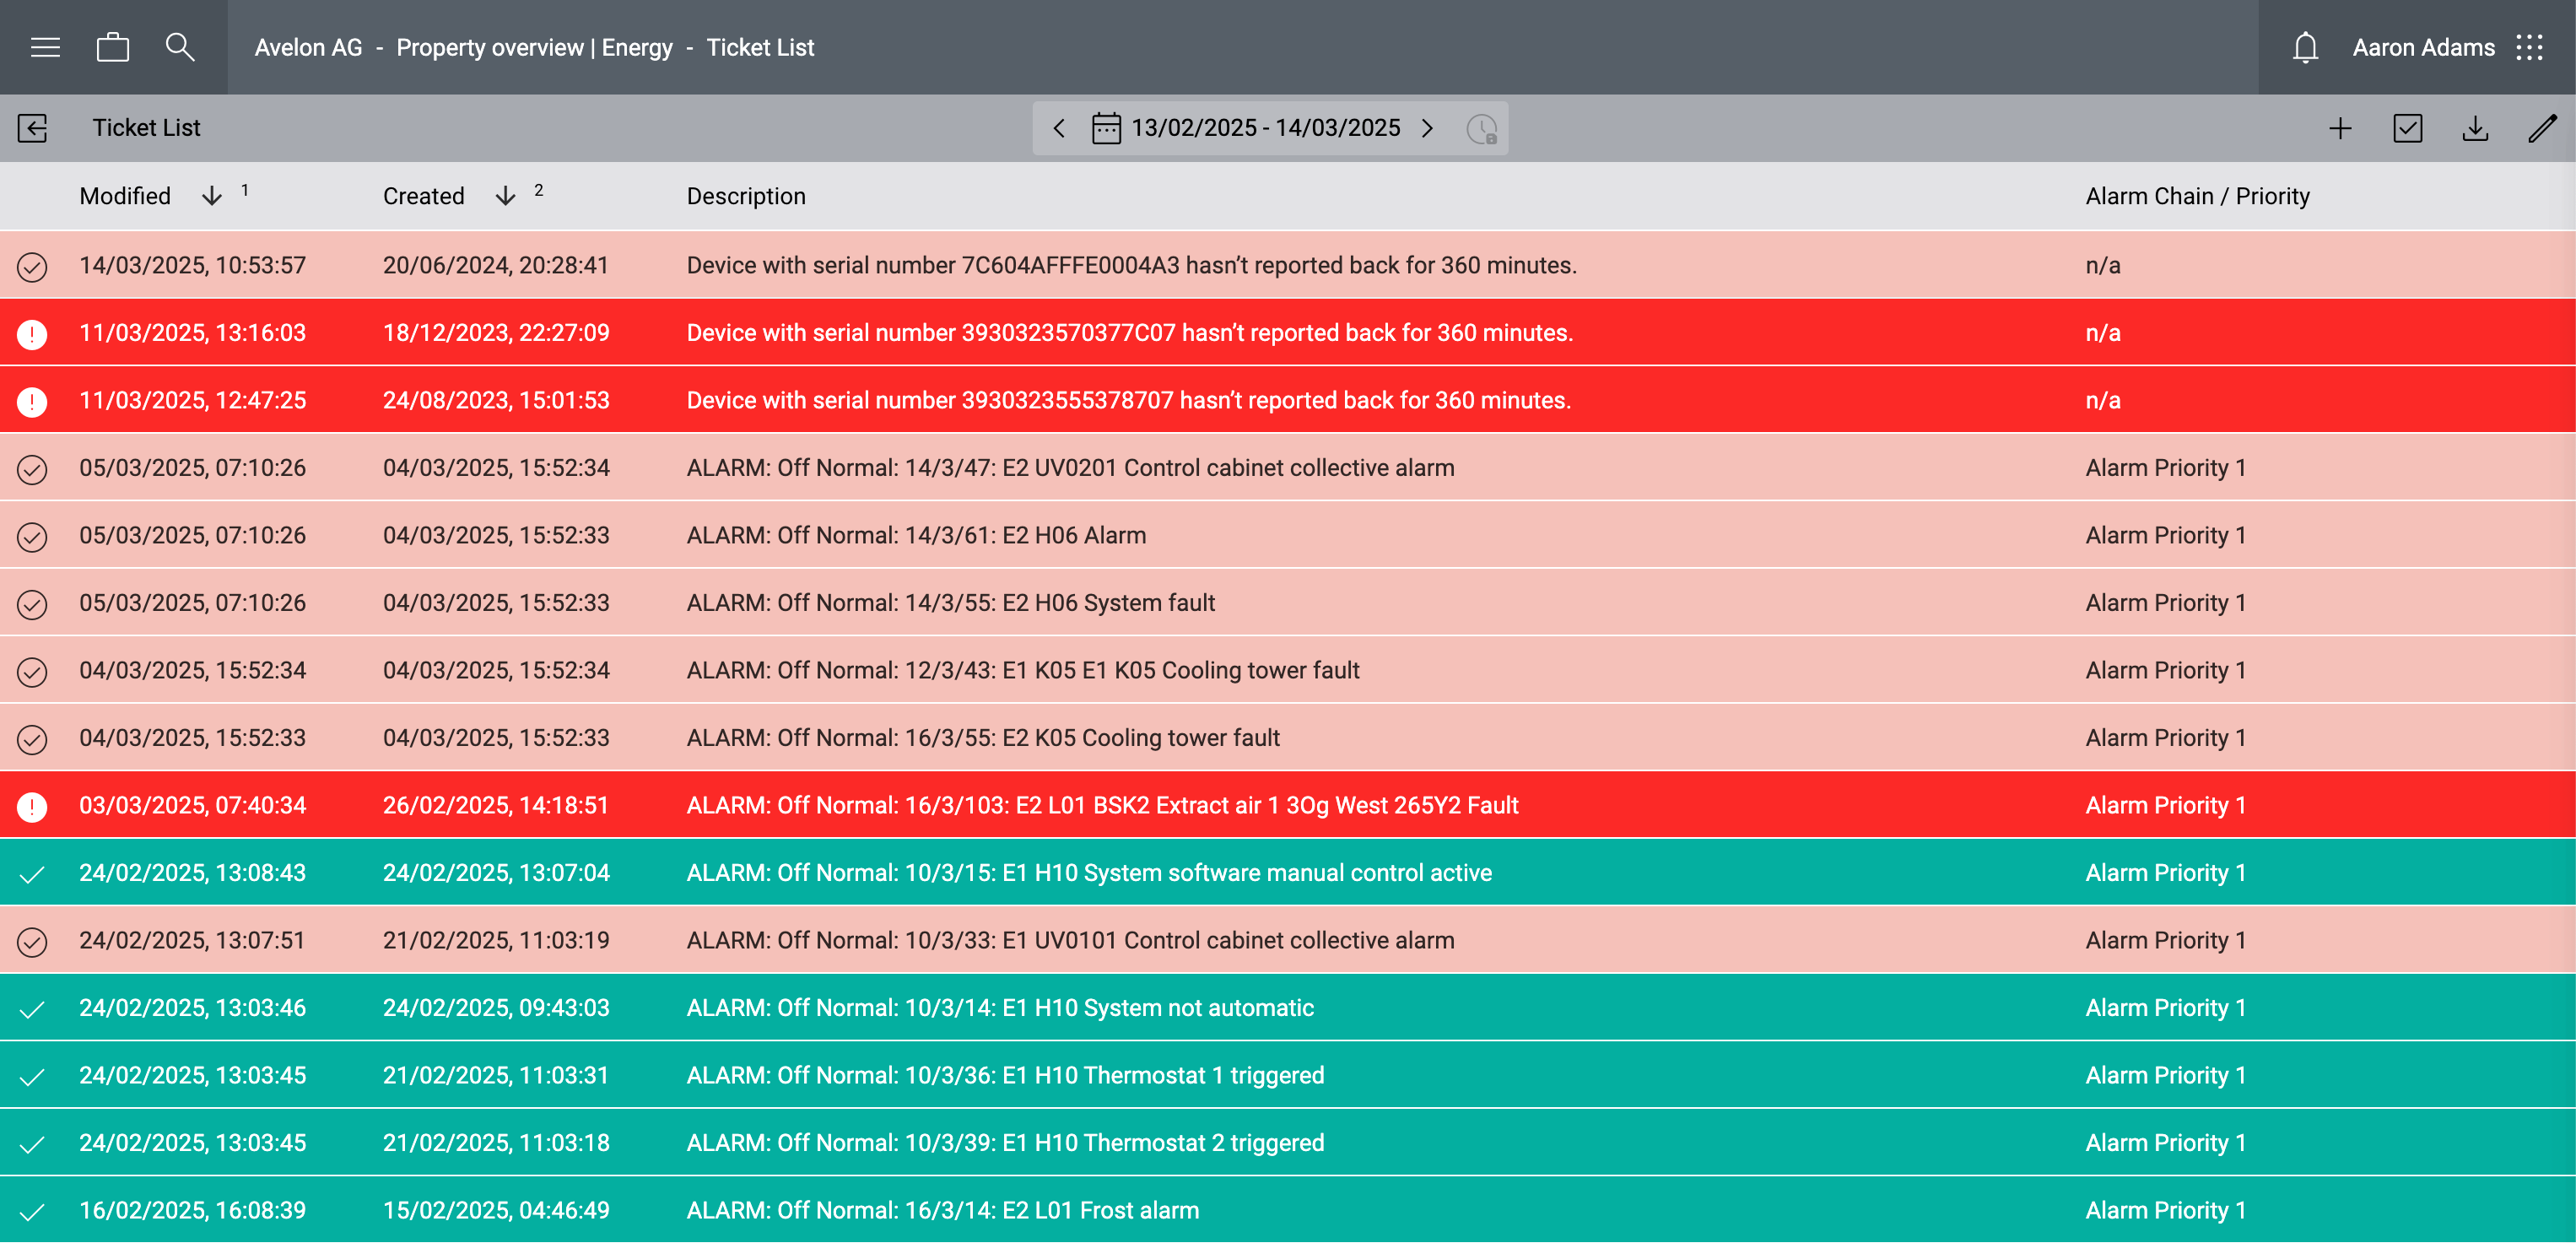
The standard view displays all tickets from the set time interval. Individual columns can be sorted in ascending or descending order by clicking on the column headings. The displayed tickets can be filtered by clicking on the filter symbol.

The ticket list showing tickets with various statuses
The creation and motification time of the individual tickets are always displayed in the logged-in user’s time zone. If that time zone is different from the time zone of the data point or real estate that is referenced in the ticket, the time will be displayed in both time zones when hovering over the cells in the Created or Modified column, respectively.
Ticket status
Tickets are shown in the color of their current state. You can configure the default colors via Settings in the user menu and then go to the Notifications tab.
. |
Open |
A new ticket that has not yet been acknowledged. |
. |
Reopened |
The ticket has been acknowledged before, but was reopened because the same alarm was triggered again before the ticket was closed. |
. |
Acknowledged |
The ticket has been acknowledged by a user. |
. |
Gone |
The alarm has been reported as gone by the device. |
. |
Gone and Acknowledged |
The ticket has been acknowledged by a user and the alarm has been reported as gone by the device. |
. |
Closed |
The ticket has been closed by a user and the problem has been fixed. |
. |
Suppressed |
The alarm was suppressed and no alarm was triggered. |
. |
Event |
In contrast to alarm tickets, event tickets are only informative. |
. |
Closed Event |
In contrast to alarm tickets, event tickets are only informative. |
Ticket evaluation
If you want to find the data points that generated the most tickets, or the average time those tickets were open, you can use the Ticket statistics chart to perform basic ticket analysis.