Introduction
The Service Level Agreement (SLA) widget can be used to check how long the value of a data point lies in or outside one or more specific ranges, and if this duration exceeds a given limit per year.
The widget also calculates the expected time that the data point will remain in these ranges by the end of the year (given the consumption stays constant) and can trigger an alarm if this projection exceeds a specified quota.
Overview
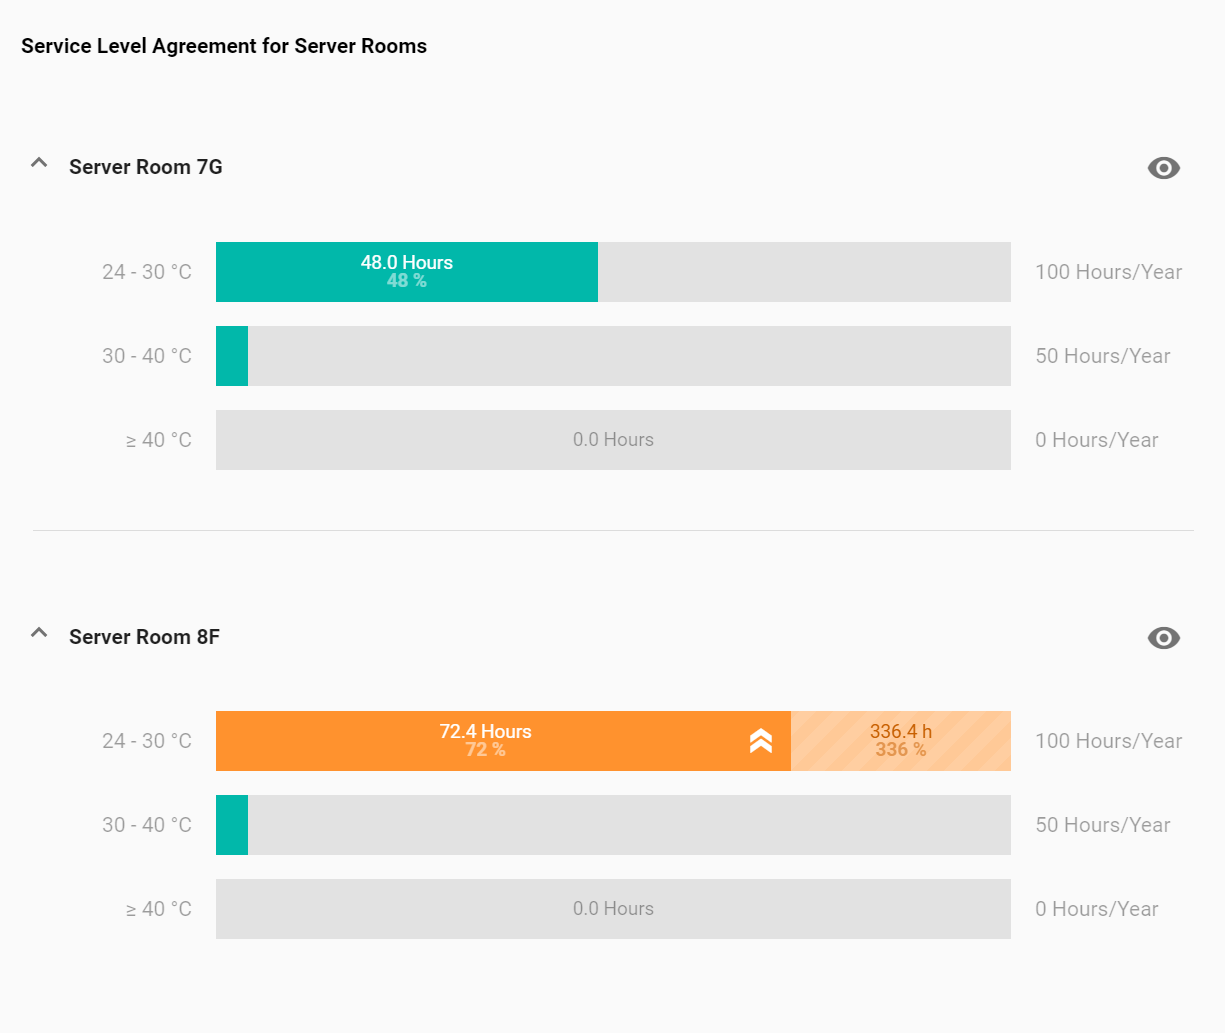
On the main view of the widget, a list of locations (data points) is displayed with their respective quotas. For each of these quotas, a bar indicates whether the calculated expected value will likely exceed the quota by the end of the year or not.
. |
A green bar indicates that the value will probably not exceed the given quota by the end of the year. |
. |
An orange bar indicates that the value will probably exceed the given quota by the end of the year. |
. |
A red bar indicates that the value already exceeds the given quota. |
Prediction
For each location, the system will take the historic values of the assigned data points from the previous year to calculate the predicted values for the current year.
Example
Assuming it’s October 1 and the data point has already exceeded a specific threshold for 19 hours his year. If this value increased by 5 hours between October 1 and December 31 the previous year, the prediction for the current year will add these 5 hours on top of the already elapsed 19 hours, predicting a total duration of 24 hours by the end of this year.
Warning
The prediction algorithm will only work if there are historic measurements available for the previous year.